


Trading with different time frames
Multiple Time Frames Analysis
Time frames are used in order to forecast future price trends. Many traders are missing out on this important aspect of trading by only looking at one time frame when trying to define a trend. Therefore its important to categorize trends as primary, intermediate and short-term trends. As a rule of thumb the primary trend is filtering out much of the market noise and is giving us more reliable signals in which direction the market is heading. Once the underlying trend is defined a trader can use shorter time frames for market entry. Also to be considered are the expected volatility of an asset within each time frame in order to set realistic exit targets. The standard procedure is to choose the main time frame you are interested in and then choose the time frame above and below to complement the main time frame. The primary time frame is used to define the trend the intermediate time frame is used for the trading signal and the short-term time frame for the exit signals.
Which time frames should be used depends on the particular asset and requires further statistical analysis. Nevertheless as a rule of thumb we suggest a ratio of 1:4. So if a trader wants to enter a position on a 15 minute chart, the hourly chart can be used as the primary trend to define the market sentiment.
Designing a multiple time frame strategy
The first step is to identify the trends by chart observation and then defining the parameters. Further improvement can be achieved by variable optimization. In the following example we will use the hull moving average to define the primary trend and to enter/exit positions based on shorter time frames. So the first step is to define the primary trend and get the bigger picture of market sentiment. We will use the following time frames in our analysis 15min,60min and daily . Remember the optimum time frame depends on the volatility of the traded asset and your profit target.
Strategy Description:
Long Entry Rules: Low of current bar is above 30 bar hull moving average (60min) and 15 bar hull moving average crosses above 30 bar hull moving average (daily).
Long Exit: If close of the current bar is lower than the close of the previous bar and if the close of the previous bar is lower than the close two bars ago and if the close two bars ago is lower than the close three bars ago.(15min)
Strategy Results after profit target and stop loss optimization:
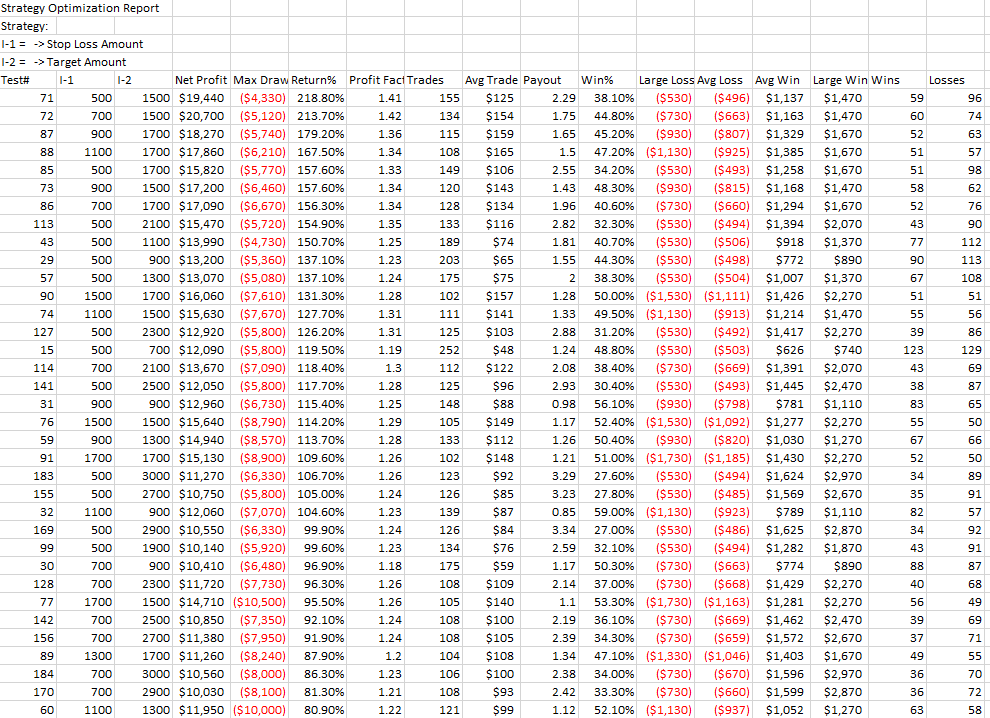
The strategy results are promising even with tight stop losses we can realize solid gains. Further improvements can be achieved by analyzing market volume. Remember that using longer time frames increases the probability of a winning trade. The trend on a longer time frame had more time to develop. Also support and resistance lines become more significant on longer time frames. Definitely the best use of multiple time frames is improved timing on position entry and exit. The important thing to remember is to pick your primary time frame then look at a time frame above it and a time frame below it. The lower time frame tells you what is happening now and the higher time frame tells you more about the fundamental aspect of the market.
What stock is this on and what time period?
Gold Futures, Continuous Contract from 12/30/2010 to 9/27/2016