Unveiling the Secrets of Profitable Cryptocurrency Arbitrage: A Comprehensive Guide
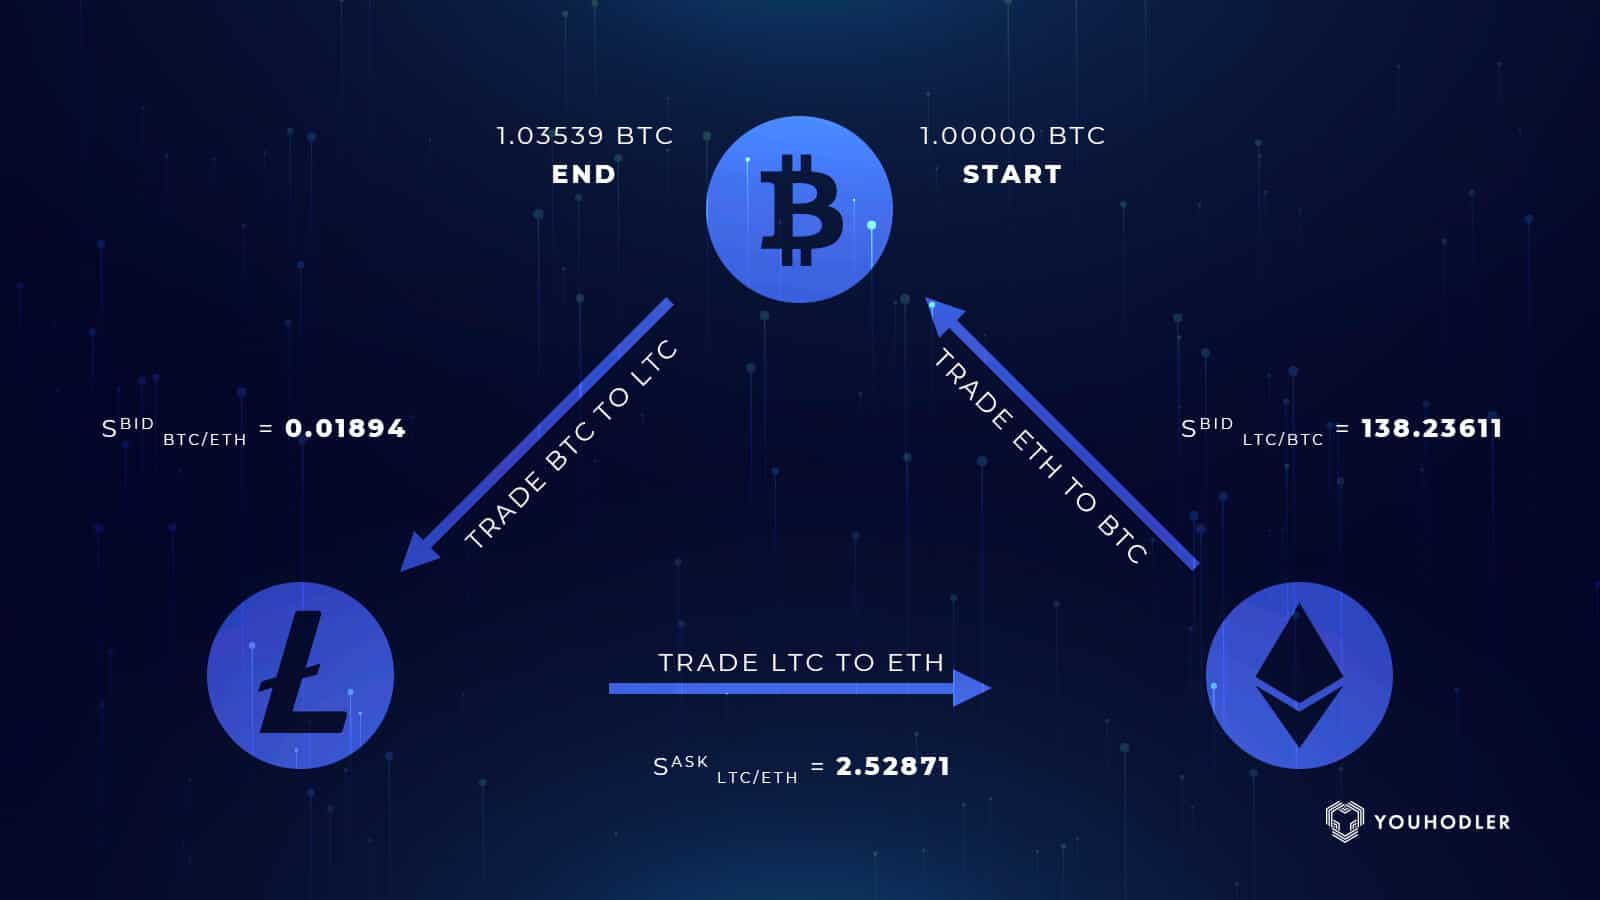
Recently, there has been a dramatic increase in online discussions about “arbitrage,” particularly in the context of cryptocurrencies. A wide range of individuals, ranging from casual coders to self-described DeFi experts, are claiming substantial profits through self-programmed crypto trading bots, often built using instructional content sourced from platforms like YouTube. Even more surprising is the fact that some initial coin offerings (ICOs) have successfully raised capital based on arbitrage-focused narratives, despite offering little in the way of meaningful technical explanation or demonstrating team expertise in actual arbitrage trading or market microstructure.
These conversations aren’t just happening in niche internet forums. They’re actively circulating within prominent tech communities in Silicon Valley, Hong Kong, and New York, with developers and startup founders expressing excitement about the profit potential in crypto arbitrage. Drawing on our experience in arbitrage trading, financial engineering, and high-yield investment strategies, we felt compelled to cut through the noise and offer a clearer, more grounded perspective. Our aim in this article is to clarify the concept of arbitrage, outline its core classifications, and examine where genuine opportunities still exist within the crypto markets today.
To be blunt, opportunities for what is traditionally known as “deterministic arbitrage,” where identical assets trade at different prices across two exchanges, were plentiful in the early days of crypto. Up until late 2017, the market’s fragmentation, slow data propagation, and lack of institutional trading infrastructure created arbitrage scenarios that were practically risk-free. However, those straightforward opportunities have mostly disappeared due to maturing market conditions. What remains are more nuanced and competitive areas of arbitrage, namely statistical arbitrage, regulatory arbitrage, and a hybrid approach we call “hashing arbitrage,” which merges concepts from several disciplines, including mining economics and infrastructure differentials.
Although true low-risk arbitrage opportunities are now rare, they haven’t disappeared completely. However, those with the most intimate knowledge of how to uncover and execute these strategies have little incentive to share them publicly. Unlike in academic finance or traditional institutional research, where publishing results can lead to career advancement, the crypto trading world rewards secrecy. That’s why you won’t find working crypto arbitrage strategies on Kaggle, GitHub, or in Medium articles. The ethos of open-source collaboration that exists in Silicon Valley is notably absent when it comes to profitable trading techniques. On Wall Street, confidentiality agreements and strict IP protections enforce silence. In crypto, discretion is driven purely by the need to preserve alpha.
Let’s define the term at the center of this conversation. According to Merriam-Webster, arbitrage is:
“The nearly simultaneous purchase and sale of securities or foreign exchange in different markets in order to profit from price discrepancies.”
That definition is key. True arbitrage hinges on near-simultaneity. If there’s a delay, even of a few seconds, then what you’re engaged in is not arbitrage in the strictest financial sense but directional speculation with embedded risks. Throughout this article, we will reference this distinction repeatedly.
While we won’t go into depth on regulatory or hashing arbitrage here, it’s worth pausing to define regulatory arbitrage with a trusted industry explanation. As Investopedia puts it:
“Regulatory arbitrage is a practice whereby firms capitalize on loopholes in regulatory systems in order to circumvent unfavorable regulation. Arbitrage opportunities may be accomplished by a variety of tactics, including restructuring transactions, financial engineering, and geographic relocation. While it’s difficult to entirely prevent regulatory arbitrage, its prevalence can be limited by closing the most evident loopholes and increasing the costs associated with circumventing regulations.”
Now, before we begin unpacking deterministic versus statistical arbitrage and clarifying which type most crypto traders are unknowingly referencing, it’s important to first understand the function of market making, which forms the structural basis for liquidity and pricing in any tradable asset.
Whenever someone wants to buy or sell a financial instrument, they typically do so through an exchange, where market participants place buy and sell orders. These orders form the order book, and the balance of supply and demand is reflected in the current bid and ask prices. The bid price is the highest price a buyer is willing to pay, while the ask price is the lowest price a seller is willing to accept. The difference between these two prices is known as the bid-ask spread.
Exchanges rely on market makers to provide continuous liquidity by quoting both buy and sell prices for assets. The term “market maker” is derived from their function: they make the market by standing ready to trade on either side of the book. Market makers aren’t trying to predict future price direction; instead, they aim to profit from the spread between bids and asks. However, when a market maker is hit on either side of their quote, they assume market risk. To manage this, they often hedge their positions using correlated instruments, futures, or other strategies that reduce exposure.
Because of the volatility and complexity of financial markets, market makers need a deep understanding not only of the assets they’re quoting but also of related markets that can be used to hedge or offset risk. This requires sophisticated modeling, real-time analytics, and constant adaptation to changing market conditions.
The role of market makers has evolved dramatically due to technology. Competitive market making across global exchanges now requires low-latency infrastructure, colocated servers, and automated trading algorithms capable of adjusting quotes dynamically. Leading firms like JPMorgan, Morgan Stanley, and Goldman Sachs have dedicated teams and infrastructure for this purpose. In the cryptocurrency space, however, regulatory uncertainty and fragmented infrastructure have delayed the participation of these major players. Most crypto market making is handled by native firms and high-frequency trading operations specifically tailored to the unique characteristics of digital assets.
To remain competitive, modern market makers must invest heavily in both technology and talent. They build proprietary trading systems, develop latency-optimized connectivity with exchanges, and hire top-tier quantitative developers and traders. In doing so, they contribute to market efficiency by narrowing spreads and reducing transaction costs for all participants. Without market makers, even the most basic arbitrage strategies would be nearly impossible to execute.
With a solid understanding of market mechanics in place, we can now dive deeper into the core arbitrage strategies being discussed in the crypto community, starting with deterministic arbitrage, followed by statistical arbitrage, and the advanced techniques that bridge both.
In order to ensure sufficient liquidity, exchanges rely on professionals known as market makers who continuously provide bid-ask spreads to the market. These market makers are responsible for creating a market, hence the term “market makers.” Their objective is not to predict the price movement of a product but to profit from the difference between the bid and ask prices, also known as the spread.
When a market maker trades on either side of the spread, they take on a position in the market, which introduces a certain level of risk. To mitigate this risk, market makers employ various strategies such as hedging their positions with different products. Consequently, market makers need to possess a deep understanding of the product they are making markets in, as well as its relationship with other similar financial products.
Over time, competition and advancements in technology have significantly transformed the role of market makers. To provide competitive quotes across multiple exchanges and products, market makers now rely on trading algorithms and electronic exchange connectivity facilitated by computer systems. Major investment banks like JPMorgan, Morgan Stanley, and Goldman Sachs dominate this financial activity. However, their presence in the cryptocurrency markets remains limited due to regulatory constraints.
To stay competitive and contribute to efficient financial markets, market makers must continuously invest in technology and skilled professionals. These advancements and increased competition have made the job of market makers considerably more complex. By tightening the bid-ask spread, market makers provide tangible benefits by reducing transaction costs associated with buying or selling securities.
Now, armed with a basic understanding of liquidity and the influence of technology, we can differentiate between two main types of arbitrage: deterministic arbitrage and statistical arbitrage.
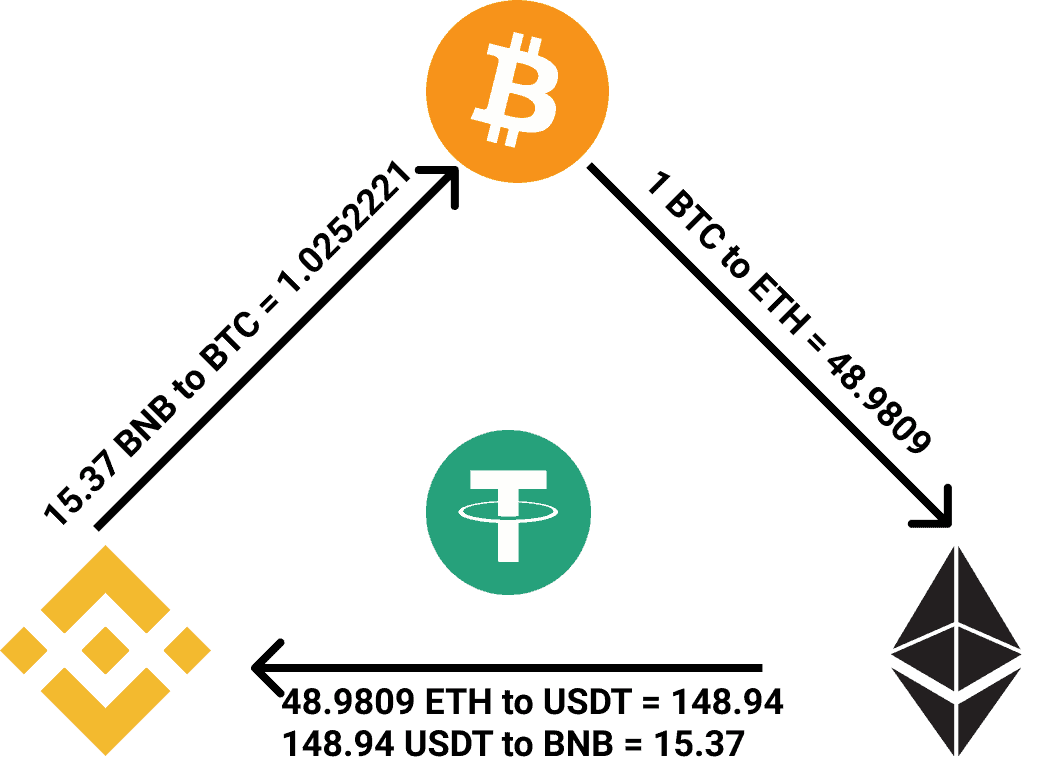
Deterministic arbitrage occurs when an investor simultaneously buys and sells an asset to profit from an existing price difference on similar or identical securities. This arbitrage technique enables investors to regulate the market and help minimize price discrepancies, ensuring that securities trade at fair market values.
However, due to technological advancements in trading traditional securities, profiting from pricing inefficiencies in the market has become extremely challenging. Leading financial institutions heavily invest in IT infrastructure and computerized trading systems to monitor fluctuations in similar financial instruments. Any opportunities arising from inefficient pricing are swiftly seized, often within seconds.
Technology has always provided an edge to those who possess it, as demonstrated by the visionary individuals who capitalized on price differentials between stock exchanges in California and New York during the early 20th century. Back then, those who had access to cutting-edge technologies such as private telephones and telegraphs could obtain price information for certain railroad stocks in California and New York during times of volatility, enabling them to execute risk-free transactions through their brokers.
Arbitrage in the cryptocurrency market follows a similar pattern to that of legacy securities. Until late 2017, there was virtually no institutional presence in the cryptocurrency asset class. If you possessed knowledge of Python, basic data analysis skills, and a rudimentary understanding of finance, you could have potentially made some money through what you might label as “deterministic arbitrage.”
We established an “Arb Event” as a time-based function and utilized the data we gathered to compile a table. Through our analysis, we discovered that the most significant arbitrage opportunities in terms of both frequency and value occurred last year in the BTC-USD/USDT and BTC-ETH trading pairs.
During that specific period, our analysis revealed that the average duration of an arbitrage opportunity was approximately 9 minutes, accompanied by an average profit margin of around 5%. Notably, the exchanges Exmo and OKCoin constituted almost two-thirds of all the arbitrage opportunities observed.
So, let’s delve into the concept of “statistical arbitrage.”
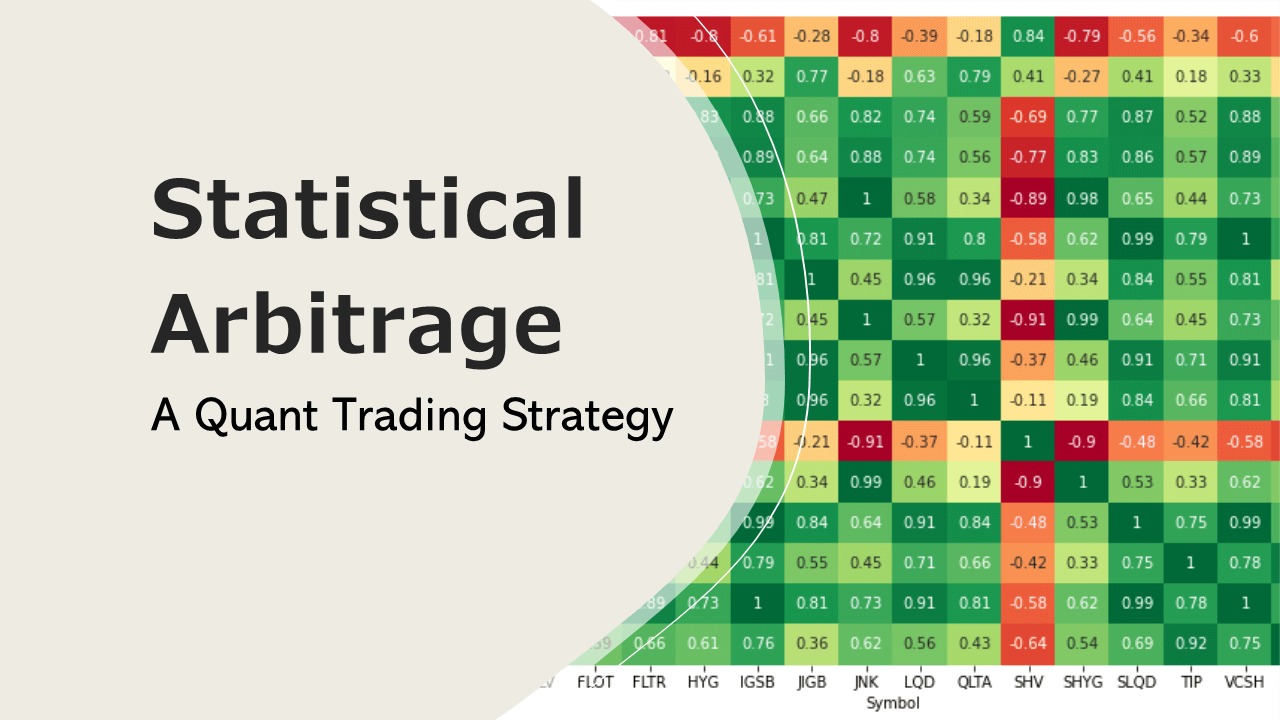
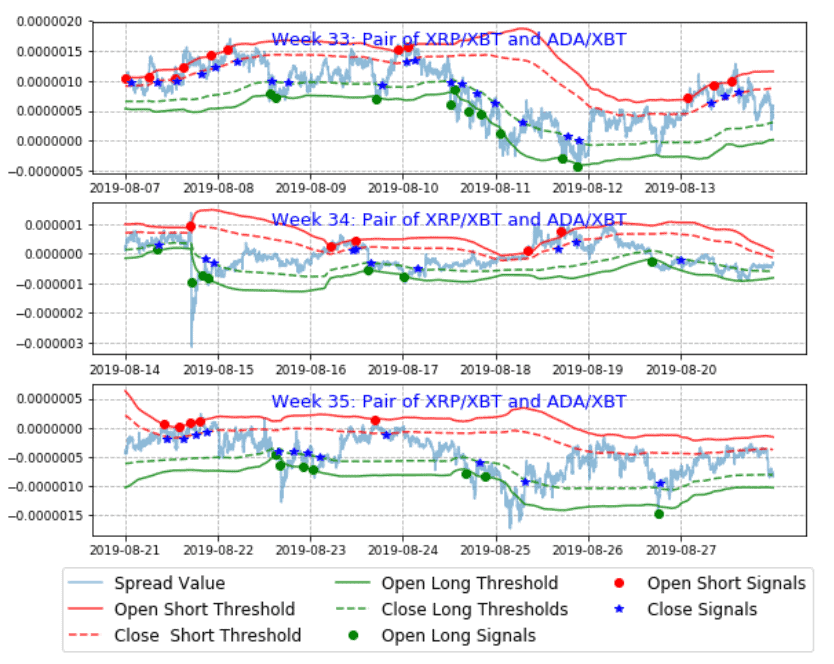
b) Statistical arbitrage is an extensively quantitative and computational approach to trading, incorporating data mining, statistical methods, and automated trading systems. In this domain, we find hedge fund firms like Quantbot Technologies, Bridgewater Associates (managing $150 billion USD), and 2 Sigma as prominent players. These firms heavily invest in technology and recruit top-notch quants from Wall Street, while also training programmers and computer scientists from Silicon Valley (who may have limited exposure to time series analysis or finance expertise) to think like quants. However, their involvement in cryptocurrencies remains minimal or insignificant.
Historically, statistical arbitrage has emerged from pairs trading strategies, where stocks are paired based on fundamental or market-based similarities. When one stock outperforms the other, the underperforming stock is bought long with the expectation that it will rise toward its outperforming counterpart, while the other stock is sold short. Mathematically speaking, the strategy revolves around identifying asset pairs with high cointegration.
In statistical arbitrage, portfolio construction entails two phases. First, the scoring phase assigns a numeric score or rank to each asset in the market, reflecting its desirability similar to Google’s page rank, but for financial assets. The scoring process is intuitive, with high scores indicating “go long” and low scores indicating “go short.”
The second phase involves risk reduction, where assets are combined in carefully matched proportions to eliminate risks. However, one must remain aware of these risks, and this is where casual crypto traders often stumble.
The scoring aspect within quant shops and hedge funds is fascinating and highly proprietary. The details of the scoring formula vary and are closely guarded. I have developed my own scoring system, which we have successfully applied to cryptocurrency trading and even mining, albeit with a different time frame.
Broadly speaking, statistical arbitrage encompasses any strategy that employs statistical and econometric techniques to generate execution signals. Unsurprisingly, statistical arbitrage has become a significant force at both hedge funds and investment banks, where many proprietary operations revolve to varying extents around statistical arbitrage trading.
Now, returning to the cryptocurrency traders claiming to have capitalized on arbitrage opportunities, in our view, they have not truly realized arbitrage profits in the strictest sense of the term.
The definition of arbitrage stipulates that “arbitrage occurs when an investor simultaneously buys and sells an asset.” However, in the current landscape, with transaction verification on different blockchains, the speed of transactions is not “nearly simultaneous.” At best, there exists a 10-15 minute window of risk, which is considerably riskier in the crypto market compared to the stock market when adjusting for median volatilities.
While some crypto traders may have achieved profits in certain instances, they have exposed themselves to risks. These risks primarily include holding the currency during the time window between acquiring cryptocurrency “A” on exchange “X,” transferring it to exchange “Y,” and selling it there. Apart from market risk exposure, they have also taken on credit risk associated with different exchanges, as well as numerous operational risks. Their lack of awareness regarding these risks and their quantification has created the “illusion” of arbitrage profits. In reality, those claiming to have realized profits have been fortunate, and liquidity risk has not worked against them. Everybody appears astute in a bull market.
To enhance the likelihood of profiting from arbitrage opportunities in the crypto market, we suggest aiming for at least two out of the three types of arbitrage mentioned earlier: deterministic, statistical, and regulatory.
Using our custom code, we currently analyze transactional accounts in cryptocurrency exchange order books, which provide valuable market insights, alongside numerous other factors. Our code allows us to:
- Identify low-risk entry and exit points
- Detect outliers in price and volume data
- Identify high-probability changes in volatility
- Construct optimal portfolios of assets to hold within specific time frames
Our objective is to consistently outperform benchmarks on a risk-adjusted basis.
import ccxt
import numpy as np
from scipy.stats import zscore

# Connect to Binance exchange
def connect_to_exchange():
    exchange = ccxt.binance({
        'apiKey': 'YOUR_API_KEY',
        'secret': 'YOUR_API_SECRET',
        'enableRateLimit': True,
        # Add additional configuration options if needed
    })
    return exchange

# Function to detect outliers in price and volume data
def detect_outliers(exchange, symbol):
    # Fetch historical price and volume data
    ohlcv_data = exchange.fetch_ohlcv(symbol, timeframe='1d', limit=100)
    prices = np.array([ohlcv[4] for ohlcv in ohlcv_data])
    volumes = np.array([ohlcv[5] for ohlcv in ohlcv_data])

    # Calculate z-scores for prices and volumes
    price_zscores = zscore(prices)
    volume_zscores = zscore(volumes)

    # Define threshold for outlier detection
    price_threshold = 3.0  # Adjust as needed
    volume_threshold = 3.0  # Adjust as needed

    # Find indices of outliers
    price_outliers = np.where(np.abs(price_zscores) > price_threshold)[0]
    volume_outliers = np.where(np.abs(volume_zscores) > volume_threshold)[0]

    # Print the detected outliers
    print("Price outliers:", price_outliers)
    print("Volume outliers:", volume_outliers)

# Main function to execute the trading strategy
def execute_trading_strategy():
    exchange = connect_to_exchange()
    symbol = 'BTC/USDT'  # Replace with the symbol you want to analyze

    # Call the detect_outliers function
    detect_outliers(exchange, symbol)

# Entry point of the program
if __name__ == "__main__":
    execute_trading_strategy()
In this example, the detect_outliers() function retrieves historical price and volume data for a specific trading pair such as 'BTC/USDT' from the Binance exchange using the fetch_ohlcv() method. It then computes z-scores for both price and volume data by applying the zscore() function from the SciPy library.
The function’s sensitivity can be fine-tuned using the price_threshold and volume_threshold parameters. Setting a higher threshold will result in fewer outliers being flagged (i.e., a more lenient filter), while lower thresholds will increase the sensitivity, capturing more anomalies. These thresholds should be adjusted based on the specific characteristics of the dataset and your particular use case.
Next, the function identifies outlier indices by comparing the absolute z-scores against the defined thresholds. It then prints the indices where significant deviations were detected in both price and volume data.
You’re encouraged to further adapt and extend the code to better align with your trading strategy. For instance, you could implement additional outlier detection techniques, visualize the anomalies, or embed the logic into a broader arbitrage system.
Tips for Using Outlier Detection in Arbitrage Strategies
When pursuing cryptocurrency arbitrage, a precise and methodical approach is critical. Before committing capital, it’s essential to:
- Quantify all risk exposures including slippage, transfer delays, and exchange solvency.
- Run robust out-of-sample testing to validate strategy performance across unseen data.
- Leverage domain expertise to interpret signals accurately and make informed decisions.
If you’re new to professional trading or data-driven strategy development, consider collaborating with individuals who have experience in financial engineering or algorithmic trading. Working with knowledgeable partners can provide deeper insight, reduce risk, and significantly increase the success rate of your arbitrage efforts.
# Install required packages
install.packages(c("quantmod", "PerformanceAnalytics"))

# Load required libraries
library(quantmod)
library(PerformanceAnalytics)

# Set the start and end date for data retrieval
start_date <- as.Date("2022-01-01")
end_date <- Sys.Date()

# Define the symbols of the cryptocurrencies to be analyzed
symbol1 <- "BTC"
symbol2 <- "ETH"

# Download historical data for the two symbols
getSymbols(c(symbol1, symbol2), from = start_date, to = end_date, src = "yahoo")

# Create a merged data frame with adjusted closing prices for the two symbols
prices <- merge(Cl(get(symbol1)), Cl(get(symbol2)))

# Calculate the spread between the two symbols
spread <- prices[, 1] - prices[, 2]

# Implement a simple mean-reverting strategy with a threshold for entry and exit
entry_threshold <- 1
exit_threshold <- 0

# Initialize variables for tracking trade positions, P&L, and equity curve
position <- 0
pnl <- 0
equity <- 0

# Define risk management parameters
stop_loss <- -0.02
profit_target <- 0.02

# Backtest the strategy
for (i in 2:length(prices)) {
  if (position == 0) {
    if (spread[i - 1] > entry_threshold) {
      # Enter a short position
      position <- -1
      entry_price <- spread[i]
    } else if (spread[i - 1] < -entry_threshold) {
      # Enter a long position
      position <- 1
      entry_price <- spread[i]
    }
  } else if (position == -1) {
    if (spread[i - 1] < exit_threshold) {
      # Exit the short position
      position <- 0
      exit_price <- spread[i]
      pnl <- pnl + (entry_price - exit_price)
      equity <- equity + pnl
      pnl <- 0
    }
  } else if (position == 1) {
    if (spread[i - 1] > -exit_threshold) {
      # Exit the long position
      position <- 0
      exit_price <- spread[i]
      pnl <- pnl + (exit_price - entry_price)
      equity <- equity + pnl
      pnl <- 0
    }
  }

  # Apply risk management rules
  if (position == -1 && pnl < stop_loss) {
    # Exit the short position with stop loss
    position <- 0
    exit_price <- spread[i]
    pnl <- pnl + (entry_price - exit_price)
    equity <- equity + pnl
    pnl <- 0
  } else if (position == 1 && pnl > profit_target) {
    # Exit the long position with profit target
    position <- 0
    exit_price <- spread[i]
    pnl <- pnl + (exit_price - entry_price)
    equity <- equity + pnl
    pnl <- 0
  }
}

# Calculate equity curve and performance metrics
equity_curve <- cumsum(c(0, equity))
returns <- Return.calculate(equity_curve)
metrics <- table.AnnualizedReturns(returns)

# Plot the spread and equity curve
par(mfrow = c(2, 1))
plot(prices, main = "Spread", ylab = "Price")
plot(equity_curve, main = "Equity Curve", ylab = "Equity")

# Print backtest results
cat("Backtest Results:\n")
print(metrics)
The Illusion of Arbitrage in Crypto: A Word of Caution
Many traders new to crypto trading misinterpret profitable trades as “arbitrage” when in reality, they’ve taken on substantial risk. True arbitrage requires simultaneous execution, which is rarely achievable in crypto due to transfer delays, volatility, and liquidity fragmentation.
Unless a trader carefully quantifies their exposure across time, price, and counterparty risk, they’re likely speculating not arbitraging. This is especially evident in environments where inflated confidence stems from rising asset prices.
Best Practices: How to Maximize Crypto Arbitrage Opportunities
To improve your odds of success in crypto trading, aim to capture at least two of the following arbitrage types:
- ✅ Deterministic Arbitrage – When clear, short-lived price gaps exist
- ✅ Statistical Arbitrage – Backed by robust quantitative models
- ✅ Regulatory Arbitrage – When different jurisdictions create pricing imbalances
By diversifying your approach, investing in automation, and deeply understanding market structure, you can build strategies that thrive in both bull and bear markets.

