
Pairs Trading An Advanced Strategy: CAD – Crude Oil

Before we dive headfirst into testing any trading strategy, it’s essential to understand what makes certain asset pairs better suited for testing than others. There’s no single, definitive answer—rather, several intriguing pathways exist, depending on your strategic approach. Let’s explore some of these possibilities and highlight the essential tools you’ll need when coding a robust pairs trading strategy.
Testing for Cointegration: Understanding Asset Relationships
The core concept behind pairs trading is quite fascinating: although predicting the exact price movement of an individual asset can often feel like navigating through fog, predicting the relative behavior between two assets can be considerably clearer. To illustrate, imagine a scenario where a man walks down the street with his dog. Individually, the paths of both man and dog seem unpredictable and random (non-stationary), wandering without a clear direction. However, the distance between the man and his dog tends to revert back to an average distance, demonstrating a predictable pattern (mean-reverting and stationary).
In financial markets, similar relationships between assets—termed cointegration—can offer profitable trading opportunities. Recognizing these patterns is a foundational step in designing effective pairs trading strategies.

So what is cointegration?
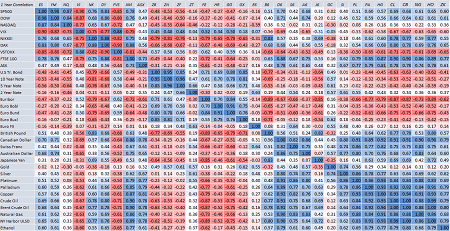
Cointegration refers to a statistical relationship between two or more quantities where they move together over time or maintain a consistent equilibrium. When two quantities do not exhibit cointegration, their movements diverge significantly over time. High cointegration indicates a strong, stable relationship, making it highly relevant for pairs trading strategies.
Association Rule Mining: Association rule mining is a technique used to uncover meaningful relationships among different stocks or market elements by identifying correlations within the data. While this approach does not directly solve pairs trading problems, it provides valuable insights. For example, rules might suggest, “If the price of AAPL rises, the price of MSFT is likely to rise as well,” based on historical correlations. Such association rules can help forecast future price movements, aiding traders in recognizing potential asset convergence opportunities.
Clustering: Clustering is a fundamental unsupervised learning technique used widely in data mining and machine learning to identify inherent groupings in datasets without prior knowledge or labels. Due to its exploratory nature, clustering is highly effective in discovering tradable pairs. Specifically, chaotic map clustering can identify stocks exhibiting similar temporal price behaviors by assigning companies to dynamic maps, with correlation coefficients acting as coupling strengths. This method naturally groups companies often within the same industry, thus facilitating portfolio optimization strategies by leveraging identified clusters within stock market indices.
Python Example – Clustering with K-Means
To perform a clustering analysis in python with K-Means clustering algorithm following packages are imported:
from pandas_datareader import data
import matplotlib.pyplot as plt
import pandas as pd
import datetime
import numpy as np
import plotly.graph_objects as go
The dictionary ‘companies dict’ is defined, with the ‘key’ being the firm’s name and the ‘value’ being the stock code of the company. There are 28 companies that are being considered.
Unsupervised Learning: Unsupervised learning models, such as K-means clustering, operate on unlabeled or unclassified datasets to discover inherent patterns. These models identify similarities within data points by grouping them into clusters. Specifically, K-means clustering initializes with K centroids and assigns each data point to the nearest centroid based on similarity. Implementing such algorithms can facilitate the identification of tradable pairs, thereby enabling further research and analysis in pairs trading strategies.
Key Issues in Pairs Trading
Pairs mining is a compelling area of research that presents various challenges and considerations for database and data mining specialists. This section addresses several key issues that researchers frequently encounter in this field.
High Dimensionality: One significant challenge in pairs mining arises from the complexity and volume of the underlying data, typically involving numerous stocks over extended historical periods. Extracting meaningful pair relationships from this high-dimensional dataset requires highly efficient and sophisticated algorithms.
Market Liquidity: Liquidity refers to the ease and readiness with which stocks can be bought or sold, driven by active investor participation. It is essential in pairs trading because liquidity influences trade execution and profitability. Traders must therefore carefully evaluate market liquidity when identifying and selecting asset pairs to ensure efficient trading opportunities.
Historical Data Considerations: Determining the appropriate amount and length of historical data to include in pairs mining is crucial. The chosen timeframe can significantly impact the predictive accuracy and reliability of pair selection decisions. Additionally, historical datasets often contain noise or random fluctuations, which can lead to misleading insights and erroneous trading signals. It is vital to carefully preprocess and analyze historical data to mitigate these risks and enhance decision-making accuracy.
Coding the Strategy
So far, we’ve talked about the statistical challenges of picking the right pair to trade. We can say that the spread between two assets is mean reverting using the cointegration test.
The next step is to define the extreme points, which will trigger trading orders for our pairs trading strategy. The z-score is a statistical construct that is used to identify these points.
The z-score is calculated from our distribution’s raw data points, resulting in a normal distribution with a mean of 0 and a standard deviation of 1. We can create threshold levels such as 2 sigma, 3 sigma, and so on using this distribution.
###Formula for the z-score###
z= (x-mean)/standard deviation
###Strategy entry points###
Spread=s = log(a)-nlog(b)
Calculate the z-score of s by computing its rolling mean and standard deviation over a window of t intervals (moving average). The resulting value is denoted as z. Threshold parameters are then fine-tuned based on the outcomes of the backtest.
###When Z-score crosses upper threshold###
Short asset A // Long asset B
###When Z-score crosses lower threshold###
Long asset A // Short asset B
Strategy exit points
If the spread continues to widen, we trigger an exit either through a stop-loss mechanism or a sigma-based threshold. The specific condition and configuration will be determined following the completion of our optimization tests.
###Description###
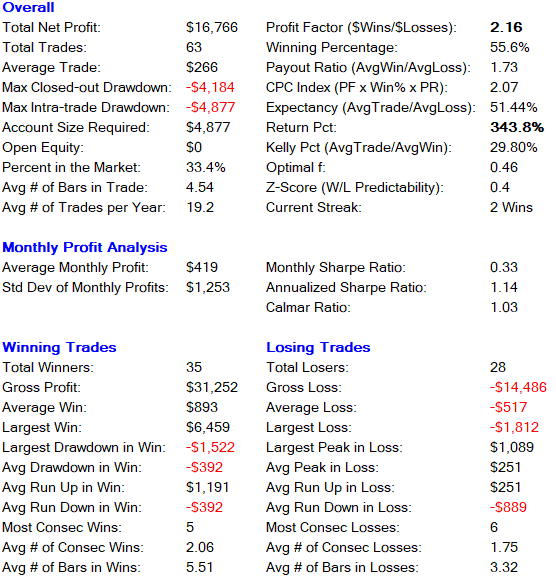
- Pair Tested: USD/CAD / NYMEX Crude Oil Futures
- Backtest Period: 01.2018 – 05.2021
- Walk Forward Analysis: 01.2014 – 12.2017
- Pyramiding: No (trading one contract per trade signal)
- Long Entry: Cross Lower Threshold USD/CAD Z Score 2
- Short Entry: Cross Upper Threshold USD/CAD Z Score 1.9
- Bars used for calculation: 8 (last 8 trading days are used to calculate the z scores)
###Strategy Exit Rules###
- Stop Loss: $1800/contract (additional safety net)
- Long Exit: If trade crosses above Z Score 0
- Short Exit: If trade crosses below Z Score 0
To determine the optimal parameters, we conducted over 10,000 backtests. The parameters shown above were selected for their consistency across key metrics including payout, profit factor, win rate, and stability. Notably, minor adjustments to these parameters do not result in performance deviations or abrupt changes, indicating a robust and well-balanced configuration.
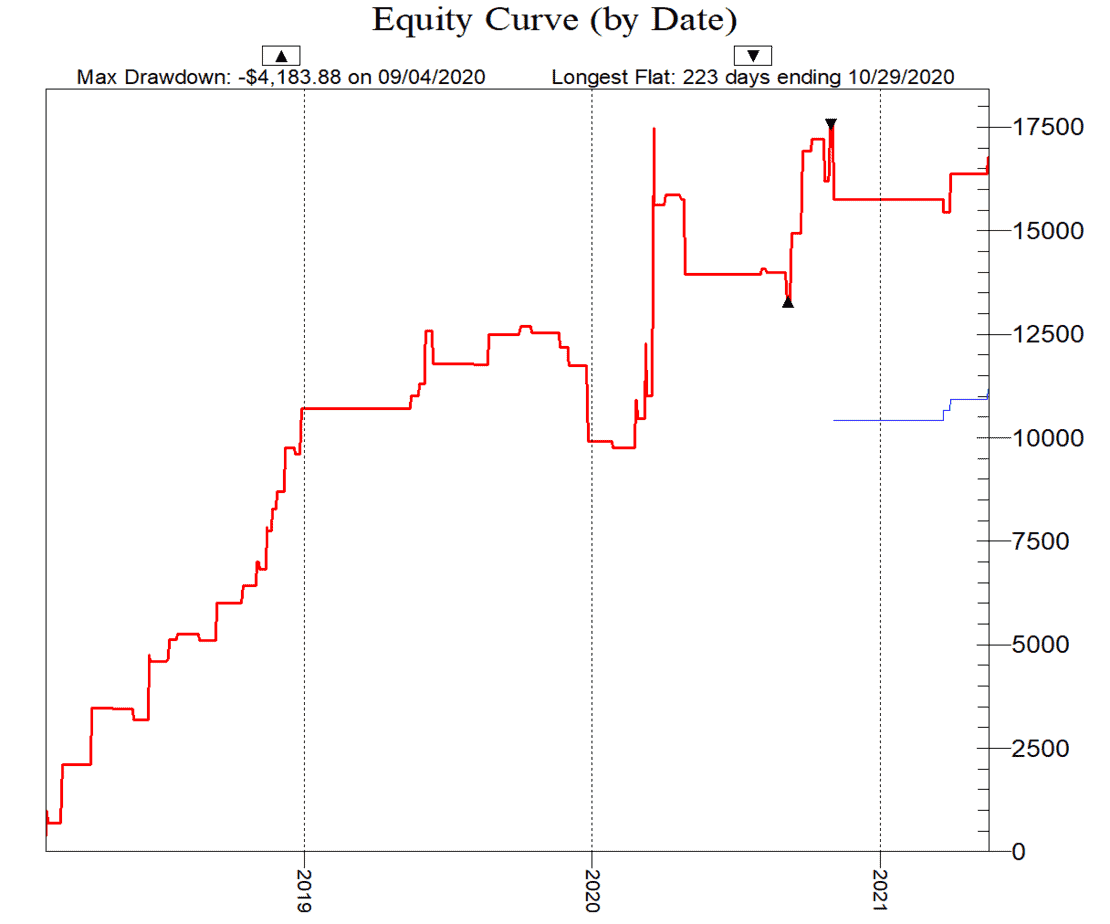
Results
###Long and Short Trades Combined Overall Trade Performance###
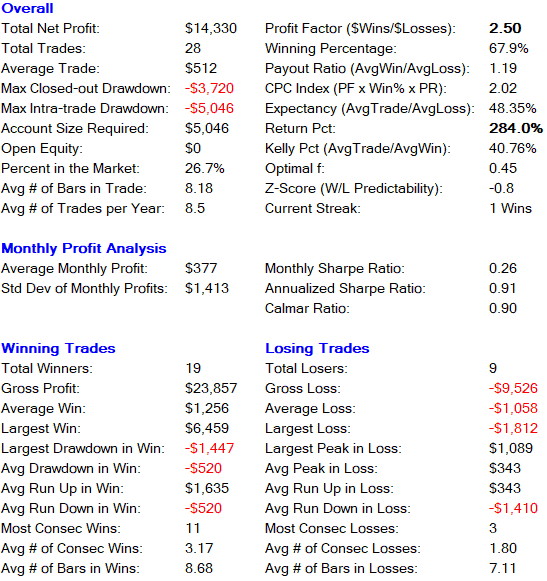
###Long Only Trades###
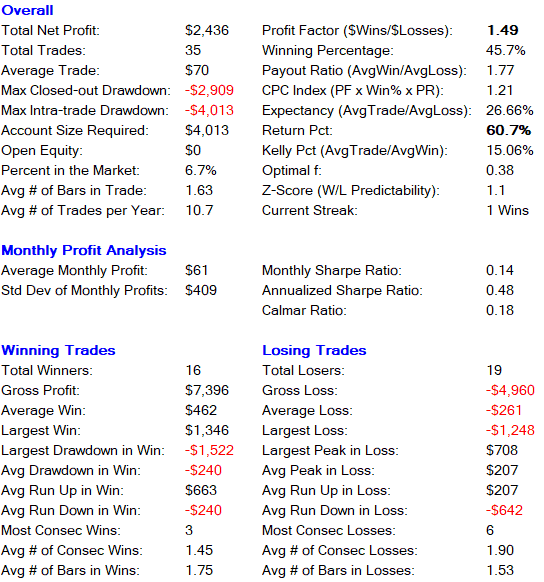
###Short Only Trades###
——————————-
Monte Carlo Simulation
By running 1,000 Monte Carlo simulations of randomly generated trades each starting with an initial capital of $50,000 and spanning a four-year period we obtain the following risk profile.
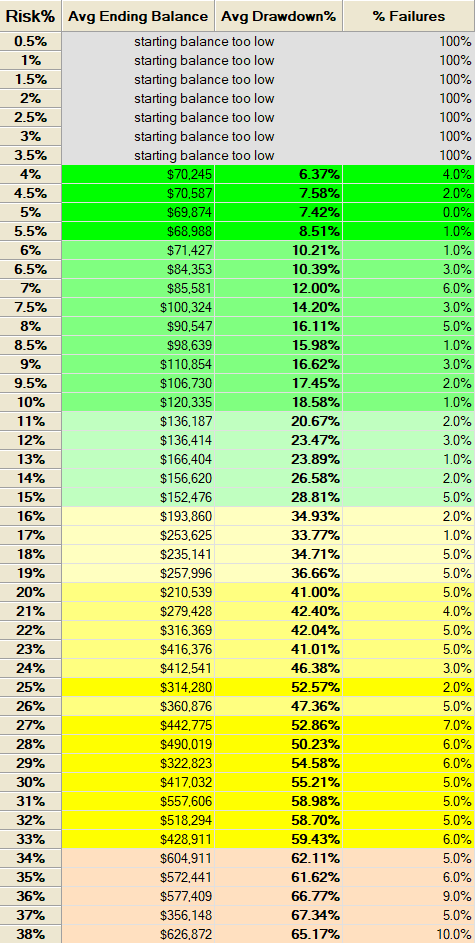
Our optimal risk exposure per trade is approximately 10%. With an initial capital of $50,000, this means the maximum potential loss per trade is $5,000. The strategy’s average drawdown sits at 18.58%, which remains within acceptable limits given the risk-reward profile.
To guard against curve fitting, few methods are as effective as Walk-Forward Analysis (WFA). This technique divides historical data into multiple training and validation segments, allowing us to optimize strategy parameters on the training sets and then evaluate performance on unseen data in the validation sets.
For this analysis, we used a training period from 2018 to 2021, and a validation period from 2014 to 2017, both drawn from our historical backtesting data.
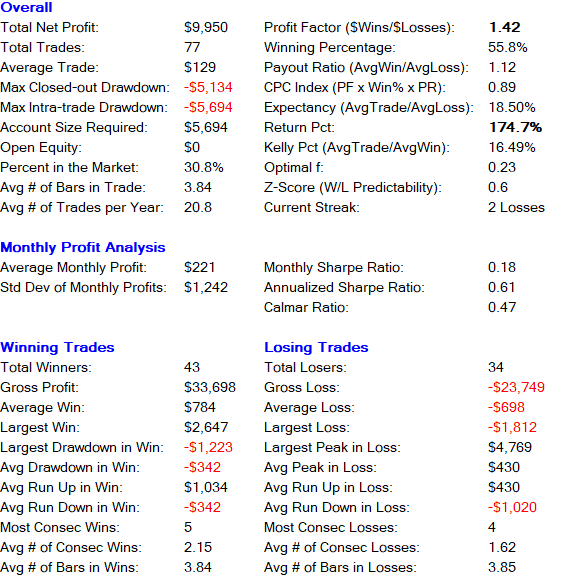
The results speak for themselves:
Return: 174.7%
Winning Trade Percentage: 55.8%
Below is a detailed breakdown of the strategy’s performance metrics based on this walk-forward validation:
Monte Carlo Simulation WFA
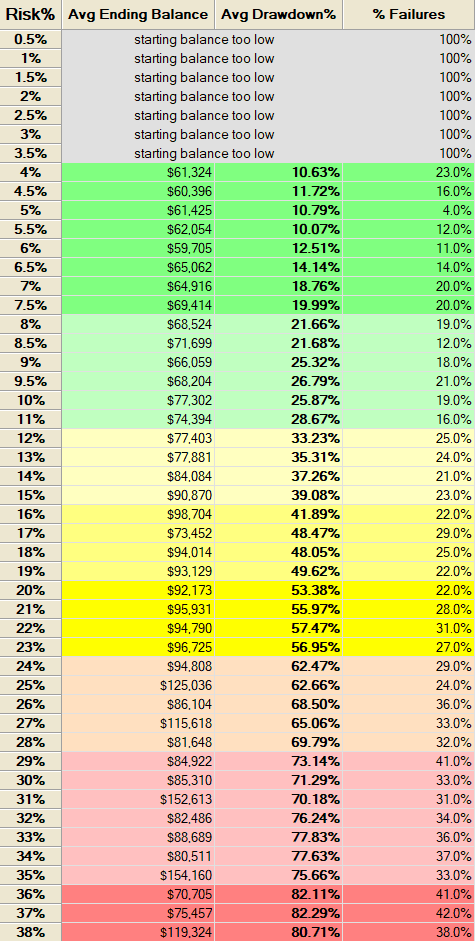
The Monte Carlo simulation reveals that if we risk 10% per trade, the average drawdown increases to 30%. More importantly, the probability of a complete account loss jumps to 19%, which is unacceptably high. To reduce this level of risk and volatility, it’s essential to adjust the stop-loss mechanism and z-score thresholds at regular intervals. Rather than using a fixed dollar-based stop loss, a percentage-based stop loss is a more adaptive and effective approach.
What’s Next: Pairs Trading 2.0
To improve stability and performance, the z-score thresholds must be dynamically adjusted based on current market volatility. In the next phase of strategy refinement, we will cluster historical data for USD/CAD and Crude Oil by volatility regimes. This is a key step toward minimizing failure rates identified by Monte Carlo simulations.
Markets exhibit volatility clustering, where large price movements are often followed by more large movements. Recognizing this, we can fine-tune our z-score entry signals (long/short) to better align with prevailing market conditions reducing exposure during turbulent periods and optimizing performance over time.
This approach enables a more resilient trading system, reducing the risk of large losses while maintaining profitability.
Conclusion
Across both in-sample and out-of-sample backtests, the strategy demonstrates consistent profitability. However, to sustain long-term performance, it is crucial to regularly adjust the z-score thresholds for entry signals based on asset volatility. Another effective tactic is to pause trading entirely when volatility exceeds a predetermined threshold.
Understanding and applying the principles of correlation and cointegration enables us to construct robust trading pairs that are more resistant to volatility shocks. By integrating adaptive z-score adjustments and an additional volatility-sensitive stop-loss mechanism, we’ve added a critical layer of protection helping the strategy withstand unpredictable market events while preserving long-term gains.