


Volume Trading Strategy
Volume Trading Friday Pattern
The number of contracts bought and sold each day in any given market, known as volume, is a good way of gauging money flow. It can predict trend changes by examining volume patterns such as sudden spikes in volume along with volatile price movements. High volume suggests high interest in the market and if it is followed by large price moves one can determine whether we have more bullish or bearish traders in a given trading session. Keeping an eye on volume is an essential tool to determine an upcoming trend or the end of a trend. Volume trading can help us identify potential reversals and give us more conviction on our trades. Know the question arises how can you effectively measure volume and discover patterns?
We’ve already learned that volume tends to increase when a market is in a strong trend and it has a good chance of continuing in the same direction. But when trying to identify times where price could reverse, we want to find an abrupt decrease in volume. A decrease in volume signals that the excitement and participation in the market has fallen, leading to a potential reversal in price.
Volume can help us in confirming breakouts. Let’s examine how we can implement a proper volume trading strategy. First of all what we need is an indicator that gives us a better understanding of what the current volume levels tell us about the state of the market. To accomplish this we need an indicator that compares the current volume of a market to the relative values during the last couple of days. We construct a volume index indicator ranging from 0-100. It will tell us where the current level of volume is relative to the volume of the last 5 trading days. The current value is expressed as a percentage between the lowest and highest that it has been over the previous X number of bars. The numbers will be between 0 (when at the lowest) to 100 (when at the highest). We calculate the values by using the close of each bar. We will have a look at the friday volume pattern. Why Friday ? Most of the time the volume will dry up on Friday going into the weekend. We are analyzing what happens if there is a spike in prices and a spike in volume. Since we are going into the weekend there is not much room left for the big players to adjust their positions if they find themselves on the wrong side of the market. This is an opportunity to be exploited as we will show in our test results.
Trading Strategy : Volatile trading session and sudden price spike on Friday. Volume Index Indicator goes over 70. We look for a reverse and short the market. Closing the position before the market close.
Test Results (Crude Oil – 5min bar period)
![(Tested on CL3-067) [Performance Reports]](https://miltonfmr.com/wp-content/uploads/2016/04/Tested-on-CL3-067-Performance-Reports.png)
Results by Month
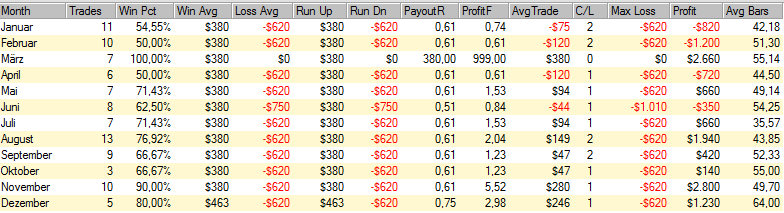
Consecutive Trades Study
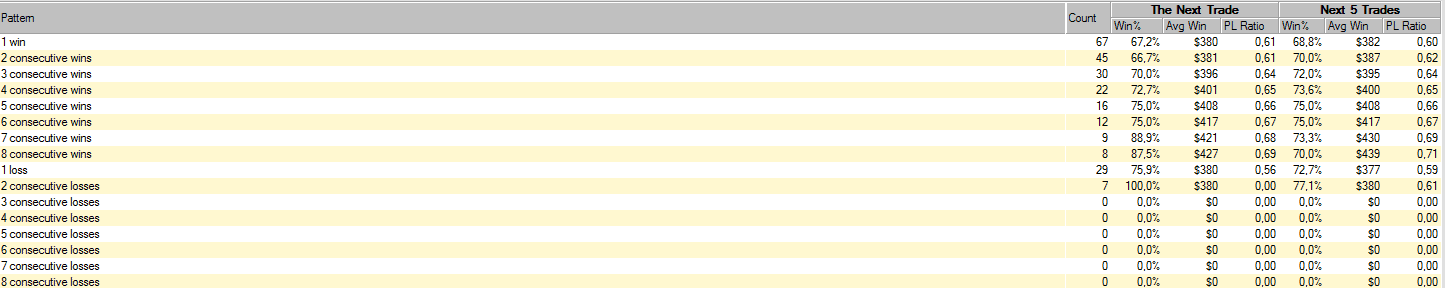
Conclusion: We can use volume in conjunction with price analysis: confirming trends, spotting price reversals, and confirming price breakouts.The Volume Index Indicator shows to be useful when applied to the 5th day of the week.
Hi there, thanks for the post!
Could you further post about the “reversal” you talk about?
Thanks
Best Regards
When we have a sudden spike in volume and price (rising volatility) we enter short after two consecutive down bars (5min. bar period). You adjust your lookback period for the volume indicator depending on the time frame and market you want to trade. On the breakout volume should pickup. The price action should head sharply lower following the breakout. When volume is high, there is a lot of activity and money changing hands therefore the volume indicator should mainly be used at breakouts to confirm the trend. The backtest results are just for illustrative purposes and can be vastly improved by implementing proper exit techniques instead of a fixed profit target.
Thanks for the reply!