Trading Patterns Cot Report

Commercial Trading Patterns
The commercial net positions are a mirror of the large trader net positions. Most of the time commercial net positions mirror the funds trading patterns but there are some important exceptions to this rule. The commercial trading pattern is to average up when the market is trending up. When the market is trending down the strategy applied by the commercials is averaging down. This strategy helps to ensure hedge protection as the market moves further against their position. They buy on weakness and sell on strength. Maximum exposure typically occurs at market turns. In very rare circumstances commercials will run out of buying/selling capacity no matter how far the prices move against them. They possess the deep pockets to stay in the trade longer than anybody else. Rare does not mean never, sometimes the commercials need to cover their positions and this can lead to significant price moves.
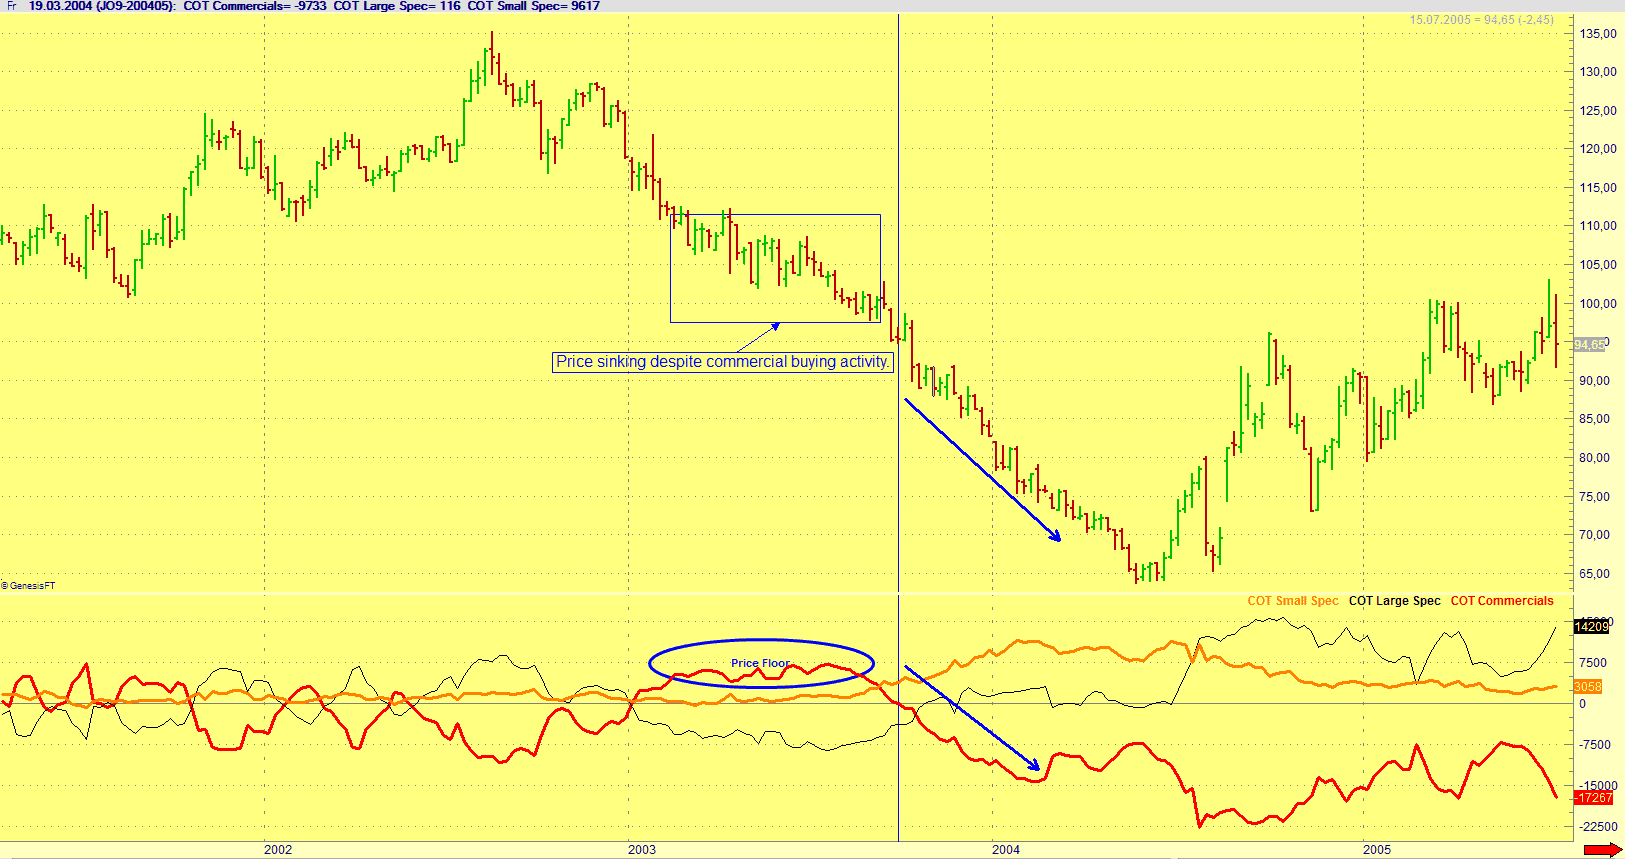
The above picture shows you the typical mirror image of commercial buying activity and falling prices till march 2003. The buying activity raised their net long positions into net long territory. It went above the net long positions of small traders. This placed a floor under prices for several months. The pattern finally changed when you look at the vertical line. Orange juice futures prices began to sink rapidly by more than 30 % despite the fact that the commercials liquidated their long positions. It created even more selling pressure. This is one of the rare occurrences of commercial activity tracking prices.
Small Trader Pattern
The small traders category shows no consistent patterns. Their net positions change depending on large speculator activity, price trends and volatility. The small trader is the least reliable part of the cot report when it comes to market timing. Their are only a few circumstances where they are useful but most of the time their net positions can be ignored. There is no valuable information that can be extracted from their net positions.
Cot Index
We are calculating the cot data for each trader group and use lookback periods with the highest probability of forecasting trend changes in each futures market. We convert the net positions to a 0 to 100 bullish scale. The number reflects where the current net positions rank as a % of its range over the recent past. The formula to calculate the index is 100 x (Current Net – Minimum Net) : (Maximum Net – Minimum Net). The minimum and maximum for the net positions depends on the lookback period. We use an optimized lookback period for each futures market separately. Our calculations show whether large commercial traders are positioned more bullish with a reading near 1oo or rather bearish with readings near 0. You have to take market cycles into account when choosing a lookback period. The Index is used as a trade setup and as a trading signal.