Optimum Asset Allocation using Correlation

Concept of Diversification and the use of Correlation
The concept of diversification is based on the concept that a trader can reduce his risk exposure by entering several positions at the same time. The success of a traders portfolio is therefore based on reducing risk rather than maximizing returns. A trader should be able to withstand a string of losses no matter how low the probability might be for a large string of losses. When testing our trading strategy its key to always test and prepare yourself for the worst case scenario. When traders begin to develop a new trading system many tend to abandon the system if there is a string of losses. The wrong way of doing it is to abandon the system too soon the proper way is implementing diversification into the equation.
Let us assume for illustration purposes the following trading results :
Trade | Profit/Loss | Cumulative Sum |
|---|---|---|
| 1 | 6000 | 6000 |
| 2 | -5000 | 1000 |
| 3 | 8000 | 9000 |
| 4 | -5000 | 4000 |
| 5 | -3000 | 1000 |
| 6 | 8000 | 9000 |
| 7 | 6000 | 15000 |
| 8 | 3000 | 18000 |
| 9 | -1000 | 17000 |
| 10 | -1000 | 16000 |
Winning Trades #5 31,000 / Losing Trades #5 -15,000
The winning trades outweigh the dollar value of losing trades by 2.07 with a winning percentage of 50%. The system can suffer from a run of bad trades. There is no guarantee in how the system will perform in the beginning. Implementation of proper diversification is therefore crucial and the key to success.
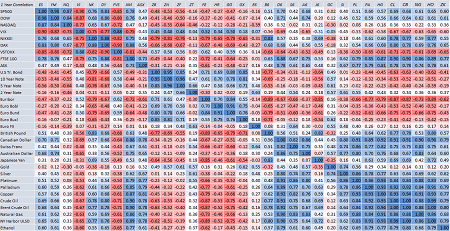
Looking at the correlation table in our previous post we diversify the portfolio by trading those commodities not highly correlated with each other ( < 0.80 and > -0.80). On the flip side if a trader enters two highly correlated positions the resulting portfolio risk outweighs the risk of trading each commodity separately. For example trading the same side of T Bond and 5 Year Note futures contracts would increase our overall risk. A trader must prevent trading two highly correlated contracts at the same time otherwise the portfolio risk rises substantially. The first thing in eliminating risk is avoiding these kind of trades so make use of our correlation table.
When looking at the correlation table the significance of correlations is important. The correlations must be consistent over time. So for example we have a highly positive correlation on the one month chart between Natural Gas and Euro Buxl. When looking at other time periods on the table we can observe that there is no statistically significant correlation between those two assets. Therefore when judging if a correlation is genuine we rework the correlations over smaller subsample periods. If the correlation numbers are consistent on the different time periods we can come to the conclusion that the correlations are genuine. It doesn’t make sense to attach too much significance to a correlation if it doesn’t persist across time. In such cases we can trade both contracts simultaneously without increasing our risk.
When trading both contracts we trade those pairs with no significant correlation at all to reduce our portfolio risk. Now how can we implement a pair trading strategy if we should avoid those with high positive/negative correlations. The keyword is intermarket analysis. Trading decisions are based on the movement of asset A and positions are entered for asset B. Thus we do not increase our portfolio risk. The intermarket relationships depend on the forces of inflation or deflation. We will design a trading strategy just to show you how easy it can be to develop and implement such a trading strategy.
Strategy Description : Analyze the relationship between S&P500 and T-Bond. Using moving averages to determine the state of the trend between those assets and their potential relationship. Enter positions for SP500 only based on the moving average and trend direction of the T-Bond.
Strategy Rules: Long Entry: 8 day moving average T-Bond crosses below 24 day moving average. Short Entry: 8 day moving average T-Bond crosses above 24 day moving average. Long Exit : Next bar high > Entry Price Short Exit: Next bar high < Entry Price Stop Loss Long Position: Lowest low of last 10 bars Stop Loss Short Position: Highest high of last 10 bars
Strategy Results
The strategy experiences two very large losses. Those losses can be eliminated by implementing a volatility based stop-loss which increases the overall strategy performance to +177%.


![2016-04-27 12_54_42-ATS – Intermarket Analysis (Tested on SP-067) [Performance Reports] – Run 04_](https://miltonfmr.com/wp-content/uploads/2016/04/2016-04-27-12_54_42-ATS-Intermarket-Analysis-Tested-on-SP-067-Performance-Reports-Run-04_.png)
![2016-04-27 12_56_33-ATS – Intermarket Analysis (Tested on SP-067) [Performance Reports] – Run 04_](https://miltonfmr.com/wp-content/uploads/2016/04/2016-04-27-12_56_33-ATS-Intermarket-Analysis-Tested-on-SP-067-Performance-Reports-Run-04_.png)

