


Following the Big Guys with the Cot Report
COT Report Analysis
The COT Report is the single most important report issued by the CFTC revealing internal market dynamics. The report is some kind of sentiment indicator. The data collected on a weekly basis contains market positions of the largest futures traders. It reveals their positions, the CFTC totals the positions of the largest traders each Tuesday and publishes them on Friday afternoon. Everybody who ignores these information is already starting with a disadvantage. The COT Report gives us essential insider market information that cannot be found in any other source. For example energy exploration companies such as Helmerich & Payne Inc. are highly correlated with the price of oil. If you can predict the price direction of oil by using the reports you will also be able to predict price direction of stocks operating within the oil sector.
Professionals have been using the COT Index data and screening the market for extremes. 100 percent COT Index readings are a setup for long positions and 0 percent are a setup for short positions. We have included these important sentiment indicators and additional triggers in our reports updating them daily. It will help you to enter a trade in anticipation of a new trend. The probability of being on the right side of the trend is increased tremendously. We compare trader position levels to their historical levels in order to judge whether current positions are out of the ordinary giving us clues of future price trends.
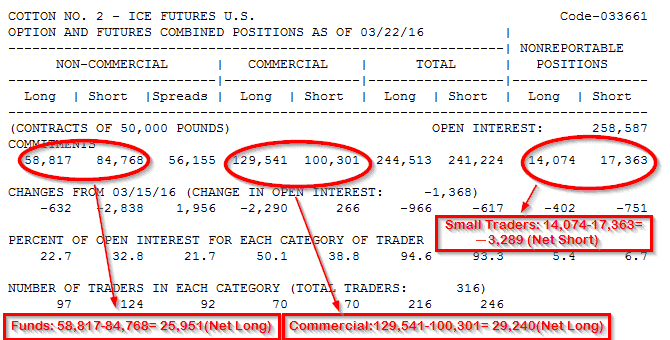
The report consists of disaggregated futures only and disaggregated futures and options combined. Those reports are separated into a long and short form. For now we will put our attention to the short form of the report. The key numbers we use are the outright positions – long/short – for the three reported trader groups. To make sense of these numbers we use net positions. Our focus lies on the Options and Futures version of the report because it is the basis for the COT Supplemental Report.
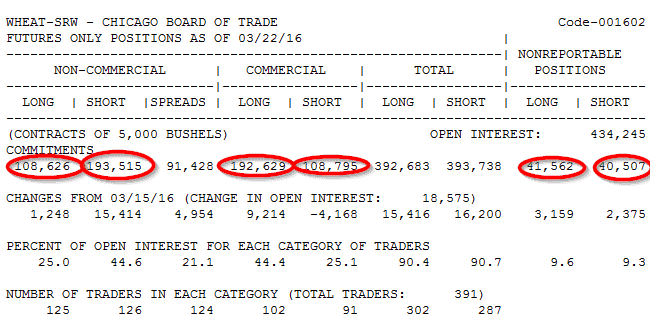
Net Positions
The Cot Report is devoted to open interest data. This is the total number of contracts for long and short positions. It is not the combined total. When a new buyer buys the seller is short. Open interest will increase by 1 if it’s a new position for both parties. Open interest will decrease if a trader being long liquidates his position by selling to an existing short position who covers by buying. A transaction that involves one existing and one new participant will not change the open interest. A common way to visualize this is by constructing a net position chart. Short positions are subtracted from long positions and the numbers are plotted on a chart. Trader groups holding more long positions than short positions are net long the opposite is net short. The important part in analyzing the COT data is comparing net trader positions to price patterns.
The above chart gives you a quick snapshot of the three groups that are either net long or net short. Looking only at the weekly snapshot of the trader groups is not enough for doing proper analysis because it provides no historical reference. The numbers must be put into perspective and this means a look back period of at least 6 months. This format will breathe life into the cot report revealing trading patterns.
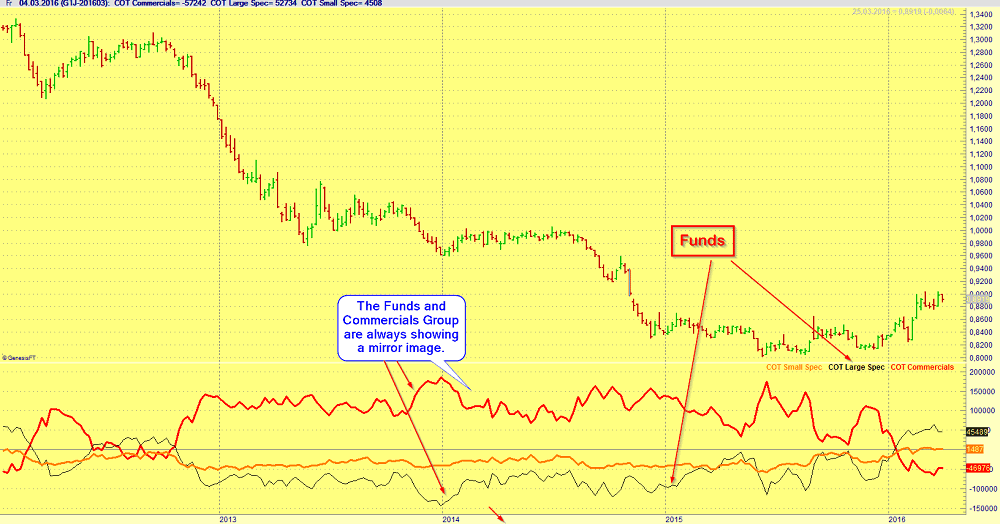
The above figure shows a mirror image in the net position patterns for funds and commercials. The buying in one group was offset by selling from the other group. In the chart above showing the Japanese Yen we can see how the buying of the commercials group resulted in a long-term downtrend. First time we see a reverse in this several year-long trend is starting to develop since March. We can see the commercials group being net short in March 2016 and the funds group net long. A caveat here, this is not a light on/off signal despite the fact that net positions are changing we need an additional indicator confirming a change in trend. Nevertheless peaks in nonspreading open interest often coincide with trend changes.
Large Speculators (Funds) Trading Patterns
Most funds are momentum traders as can be seen in the reports. Looking at weekly data we can observe the fund net positions are moving in tandem with price movement troughing and peaking. Funds are caught holding the largest position in the wrong direction when the market turns. Since they are holding a large number of contracts they cannot liquidate all their positions without depressing prices. They are giving up a large portion of their profits waiting to confirm the end of a trend. The cot data is helpful in gauging the state of fund buying and selling programs. When analyzing patterns you compare past price movements with corresponding net positions of the large trader group.
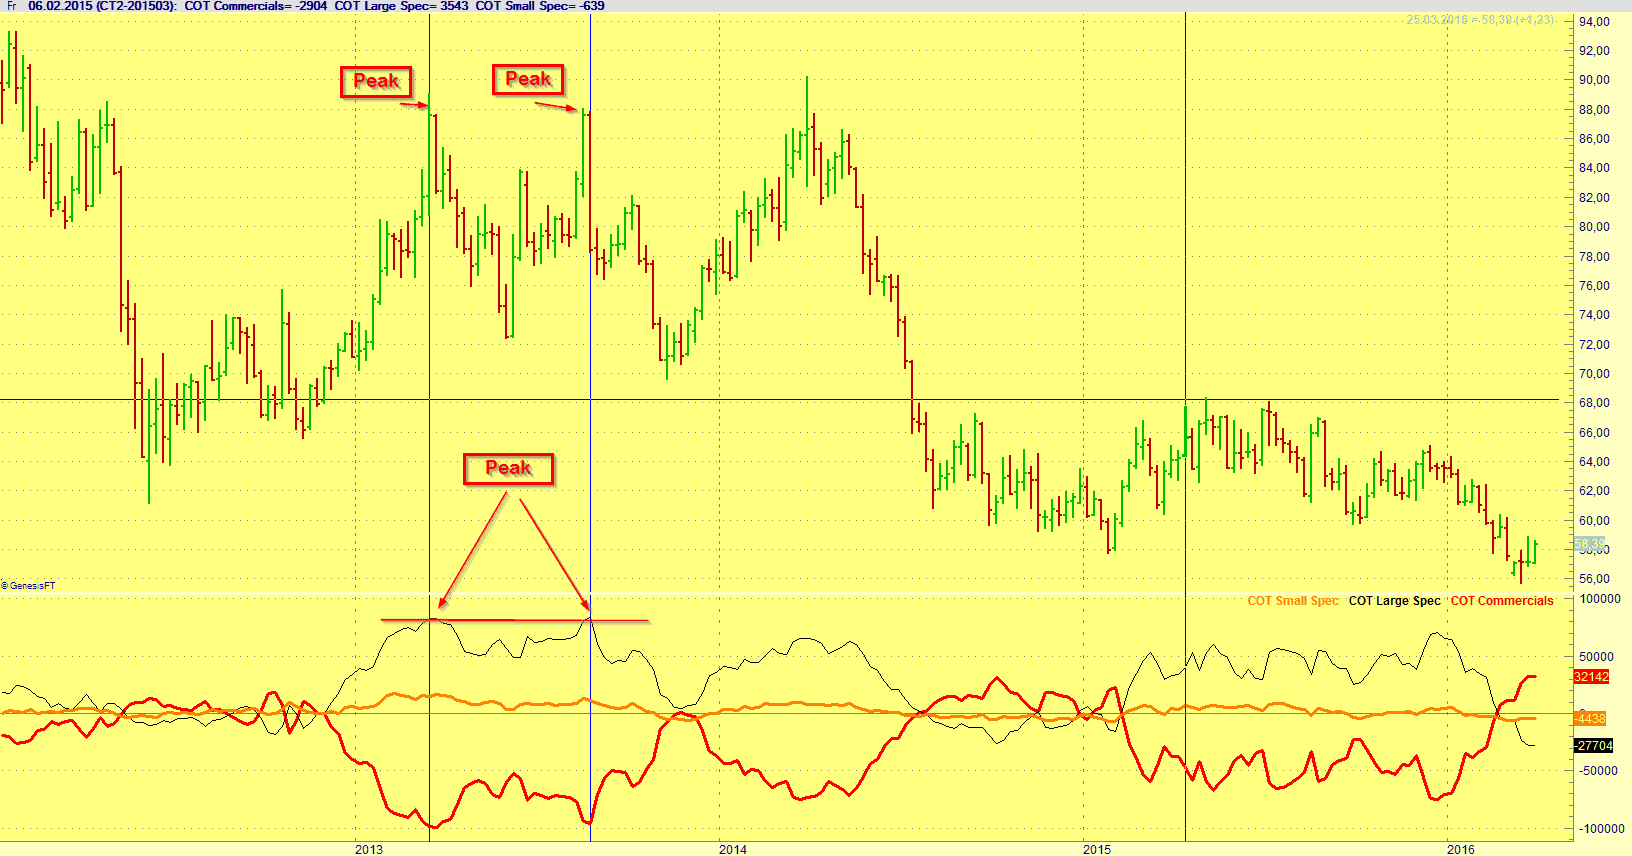
As can be seen in our chart example above (Cotton #2) prices approached the old high (year 2013) it would have been useful to predict the odds of a retreat. We can see that the next peak was the limit of fund buying capacity. It turned out to be an accurate prediction we made and prices retreated. When doing your own analysis its important to adjust the lookback period for net positions depending on the price patterns in the particular market. Never ever use the same lookback period for all markets. Every futures market has its own price behaviour dependent on crop year, seasonal movements and volatility. Only after taking into account these factors you can come up with a reasonable lookback period for the market you are planning to trade.