


Demystifying Bollinger Bands
How do we know if a price is right and when do we enter the trade ? Is the S&P 500 Index trading at 2355 for that day to high or to low. Should I buy or sell ? Proponents of the Bollinger Band say that this indicator can greatly improve your odds in being on the right side of the market.
The purpose of the bollinger band is to help you decide when to make your move by illustrating the momentum of a security. Bollinger Bands consist of a center line and two price bands above and below it. The center line is an exponential moving average. The price channels are the standard deviations of the market being studied. In order to choose the optimal value for the standard deviation and the length of the bands you must calculate the normal distribution of your time series. The normal distribution is a probability distribution that associates the normal random variable X with a probability. It is a bell-shaped curve. The curve is wide and short when the standard deviation is large.
Of course you cannot rely on a single piece of information when making your investment decision. It’s always important to consider other important market data and the proper tool for a specific situation. You have to adjust to prevailing market conditions and not the other way around. Be prepared that at any point in time everything can go south no matter how good your system is. Implement proper risk management the key to long term trading success.
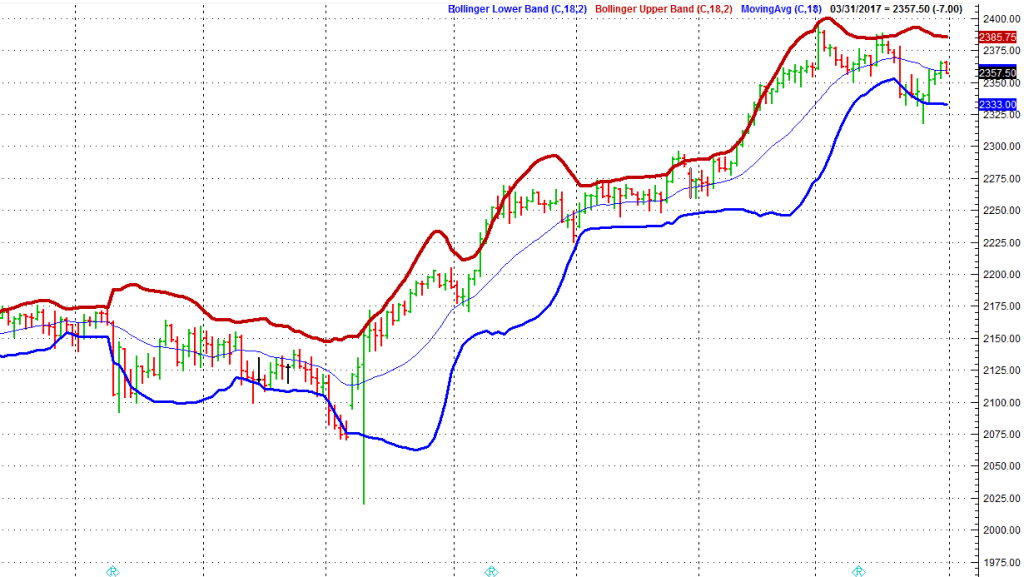
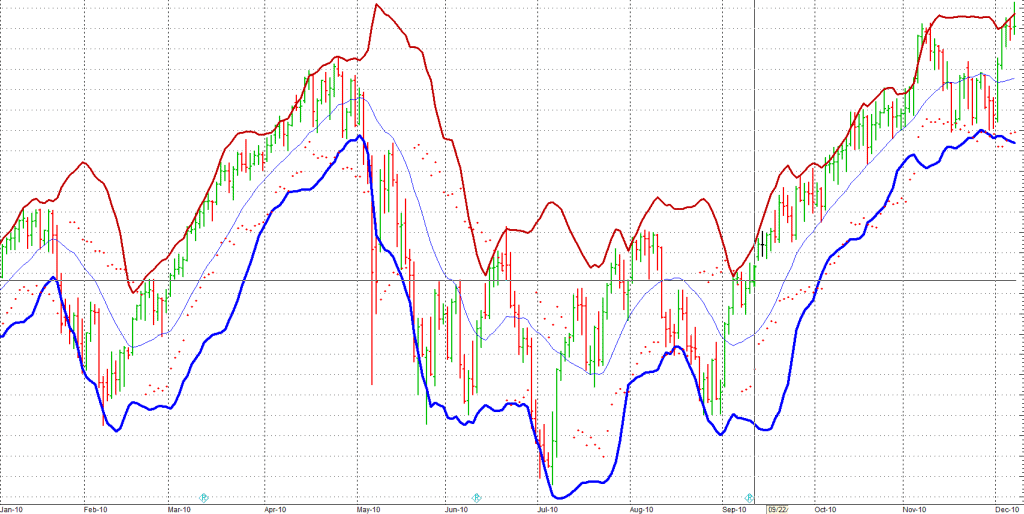
Bollinger Bands basically measure market volatility and when we talk about volatility we can already see that it all comes down to the basic market theory – mean reversion. That’s all there is to it. Have a look at the chart below. One of the main characteristics of this indicator is that price tends to return to the middle of the bands. That is the whole idea behind the Bollinger bounce – the rubber band trade. By measuring price volatility Bollinger Bands adjust themselves to market conditions.
Bollinger bands act like support and resistance levels. The longer the time frame you choose the stronger these levels tend to be. The theory says the best time to choose this kind of trading style is when the market is bouncing and returning to its mean. This is the case most of the time as our previous research has already shown. On the other hand we can have a different kind of market behavior. It happens when the bands squeeze. When bands squeeze together it indicates that there is a breakout about to occur. If the bars start to breakout significantly above the top band then the move will usually continue in that direction. If we have a breakout below the price will usually continue to go down. Also note that in these cases the downtrend happens at a faster pace.
Bollinger Bands can also indicate the end of strong trends. Strong trends cause an expansion in volatility that will cause the bands to initially move apart. When a trend begins to wane, the lower band in an uptrend will turn back up, which can be a signal for a trend change.
Now let’s test this theory and compare it to real world results.
Strategy:
- SP500 Index Future, Continous Contract
- Time Frame: Daily Bars
- In Sample Testing & Optimization – adjusting bollinger band value & stop loss/profit target
- Out of Sample Testing
- Monte Carlo Simulation
In Sample Testing & Optimization:
- Profit Target/ Stop Loss Range Test: 600 -1600
- Daily Bars
- In Sample Testing 2002 -2008
- 1246 optimization runs
- I-1: Buy after n-bar close is below the lower bollinger band // I-2: Sell after n-bar closes below the upper bollinger band
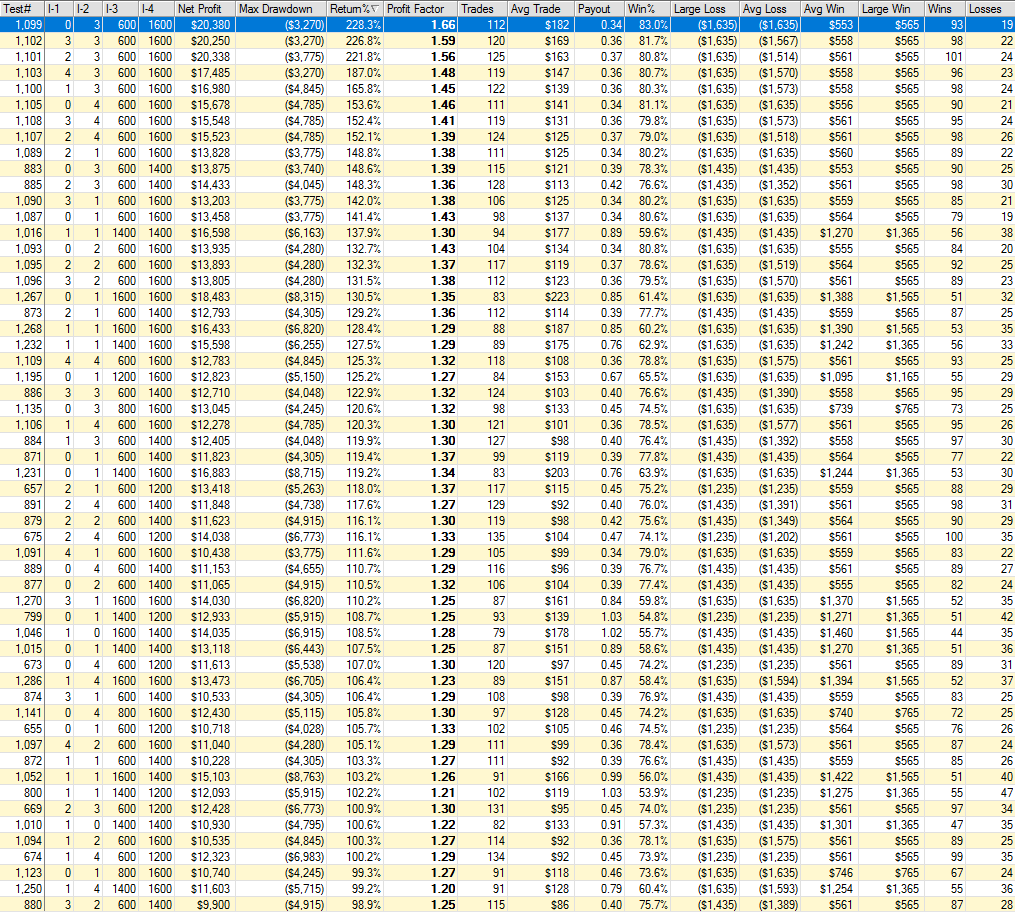
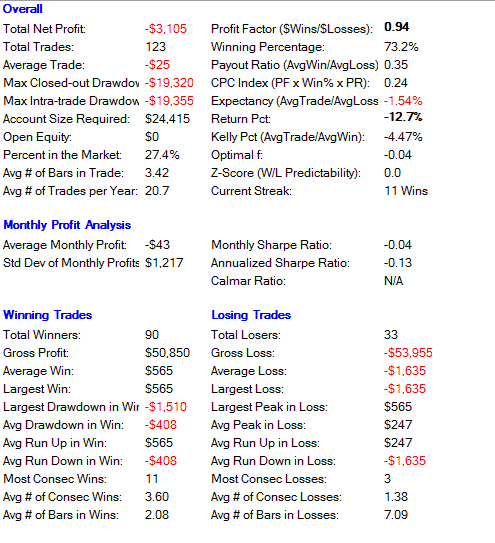
After optimizing the parameters we can see that the optimum value for I-2 is 3 bars. Which means we enter short after the third bar closes below the upper bollinger band. On the other side we don’t have any optimum value for the long entry.
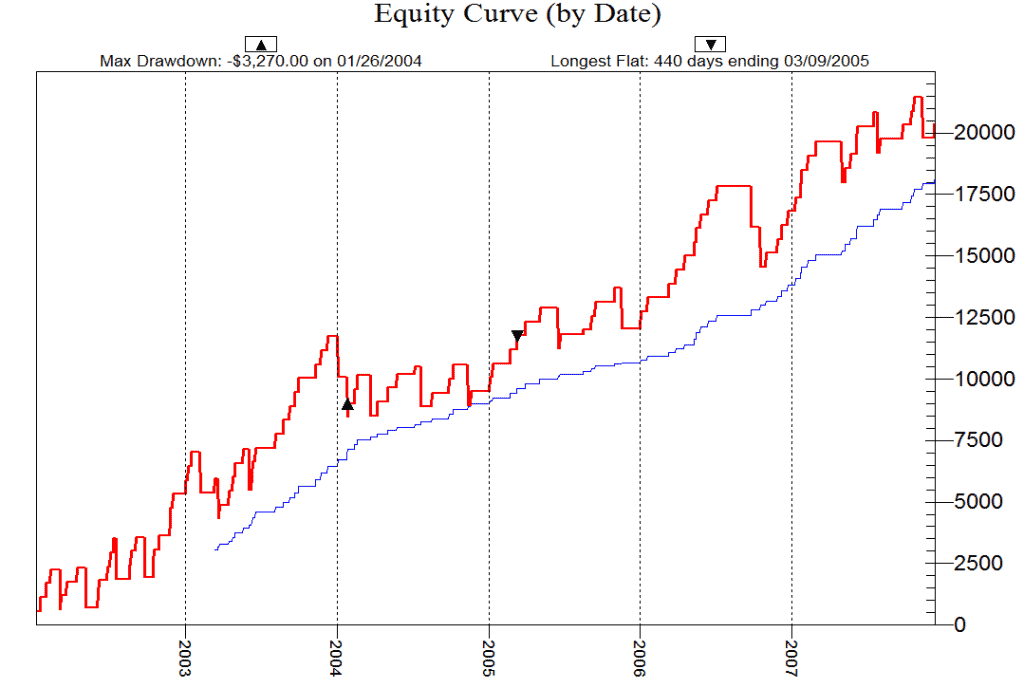
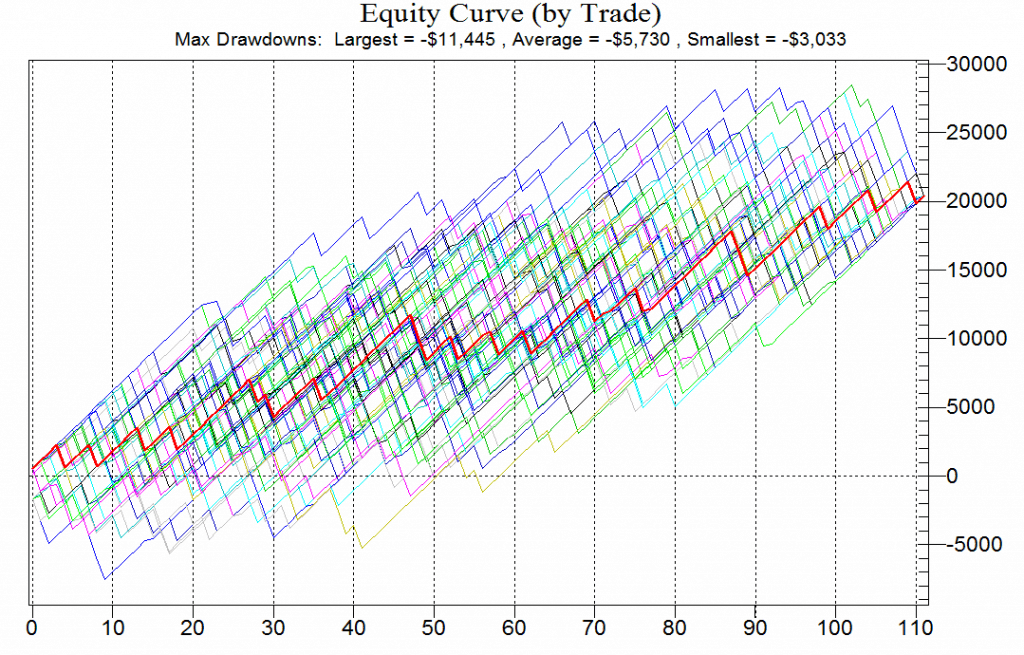
On the graph we have a very smooth up curve without any large deviations from the mean. Consistency is what you should strive for when designing your trading strategy. Large and unexpected ups and downs in your equity curve signal that something is severely wrong with your strategy.
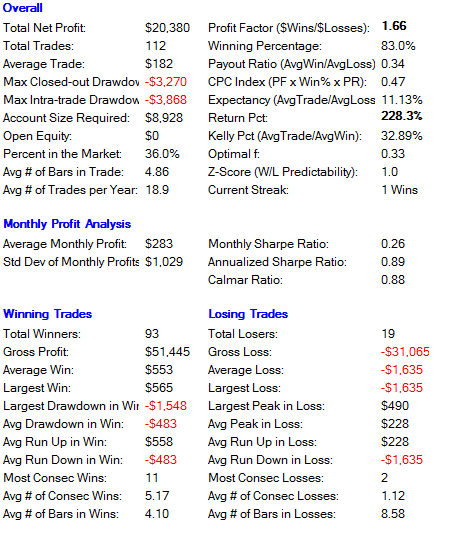
While we normally avoid a low payout ratio when analyzing our strategy results in this case we can accept it due to the fact that we have an exceptionally high winning percentage – 83%. Nevertheless always be skeptical and take results with a grain of salt. Before going live analyze every single trade !
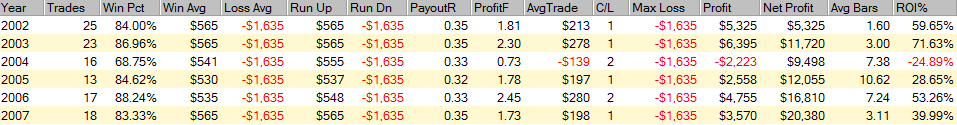
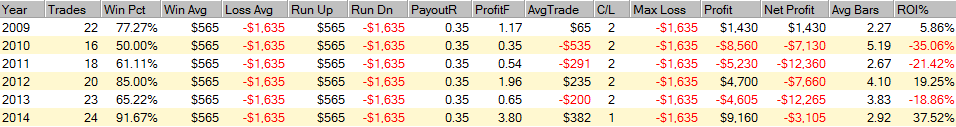
We have a solid number of trades for each year and results look promising except for 2004. In 2004 we had a prolonged period of large non directional moves without a clear trend. The strategy proved to be useless when these market conditions prevail. Another indicator/setup is needed to filter this out.
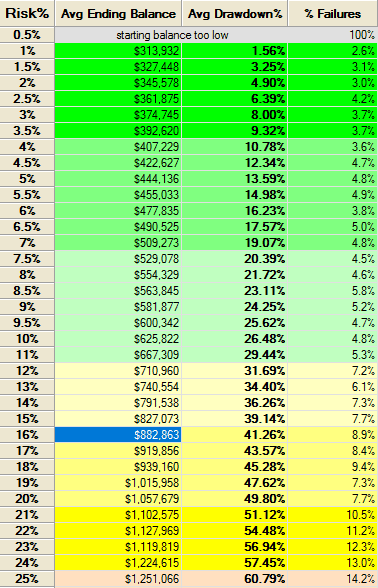
Could the backtest reports be fooling us ? To reduce the chance this could occur we complete a Monte Carlo analysis to ensure the system is robust and meets our risk requirements. The Monte Carlo results have shown that starting with a $10,000 account and a 16% drawdown limit we have a 8.9% chance of ruin and the Median Drawdown of 41.26% is higher than our drawdown limit. What can we do about this? Without adjusting the strategy rules or risk per trade it seems the best approach is to start with a higher account balance.
Out of Sample Testing & Optimization:
- Profit Target: 600 // Stop Loss: 1600
- Daily Bars
- Out of Sample Testing 2009 -20015
- No optimization
- I-1: Buy after 1st bar close is below the lower bollinger band // I-2: Sell after 3rd bar closes below the upper bollinger band
The test results are mixed with the worst year being 2010 with a very low winning percentage – 50%.
Same as with 2004 a lot of non directional high volatility moves. See chart below.
Conclusion: Clearly without any additional filter the bollinger bands produce random and non consistent results. Every attempt to improve the backtest only results in modeling errors which occur when a function is too closely fit to a limited set of data points. Using only bollinger bands for trade entry/exit always results in being late to the party when the market is swinging. So the next time when somebody says “Bollinger band is a wonder indicator” you send him this article.
Nice analysis – I like that you are willing to discuss a system that essentially doesn’t work, and the way you went about determining that. Those pesky out-of-sample tests will get you every time!
I have never understood how BB is supposed to work any way. A price series is serially correlated – not exactly iid – so prices per se do not have a meaningful distribution. What is the standard deviation of a non-stationary series supposed to tell you? It’s not a statistic that has any theoretical underpinning!
Best, Ian
Thank you.
The indicator is saddled with high lag, as virtually all SMA-based indicators are. Traders should be mindful of the delay in what the bands present. That’s also why we tried different entry bars when the trade signal was generated but still got that lag.