Unlocking the Power of Emotions: Deciphering the Fear & Greed Index
In the high-stakes world of financial markets, it’s not always fundamentals or technicals that move prices — it’s human emotion. Greed inflates bubbles; fear triggers crashes. Recognizing this, savvy investors look for tools that measure crowd psychology — and few are as insightful as CNN Business’s Fear & Greed Index.
This index is more than a sentiment snapshot. It’s a multi-factor gauge of emotional extremes, offering traders a way to time entries, exits, and risk exposure in volatile markets.
What Is the Fear & Greed Index?
CNN Business created the Fear & Greed Index to distill market sentiment into a single, intuitive number ranging from 0 (extreme fear) to 100 (extreme greed). This number is updated daily, weekly, monthly, and yearly, giving both short-term and macro-level views of investor behavior.
At its core lies a basic but powerful principle:
- Excessive fear often leads to undervalued stocks.
- Overwhelming greed can drive valuations far above their intrinsic worth.
The index, therefore, acts as a sentiment compass — alerting traders when the crowd might be on the wrong side of the trade.
Real-World Signals: Historical Context
The index’s historical extremes align eerily well with market inflection points:
- 2008 Financial Crisis: Dropped to 12 after Lehman Brothers collapsed, coinciding with the S&P 500’s plunge.
- September 2012: Surged past 90 as the Fed announced QE3, inflating equity prices globally.
- March 12, 2020: Hit a historic low of 2 amid COVID panic and Trump’s travel ban, right before one of the fastest bull runs in history.
- November 2020: Soared past 75 as vaccine optimism triggered aggressive risk-on behavior.
Time and again, the Fear & Greed Index has served as a powerful contrarian indicator.
Inside the Index: 7 Core Indicators
The index is a composite of seven sentiment-based signals, each scaled from 0 to 100. Here’s what powers the gauge:
- Stock Price Momentum: Tracks how far the S&P 500 is trading above or below its 125-day moving average.
- Stock Price Strength: Measures the ratio of stocks hitting 52-week highs vs. 52-week lows on the NYSE.
- Stock Price Breadth: Compares advancing vs. declining volume — are more shares gaining or losing ground?
- Put/Call Options Ratio: A contrarian gauge of trader fear vs. greed in the options market.
- Junk Bond Demand: Tight spreads = greed; wide spreads = fear.
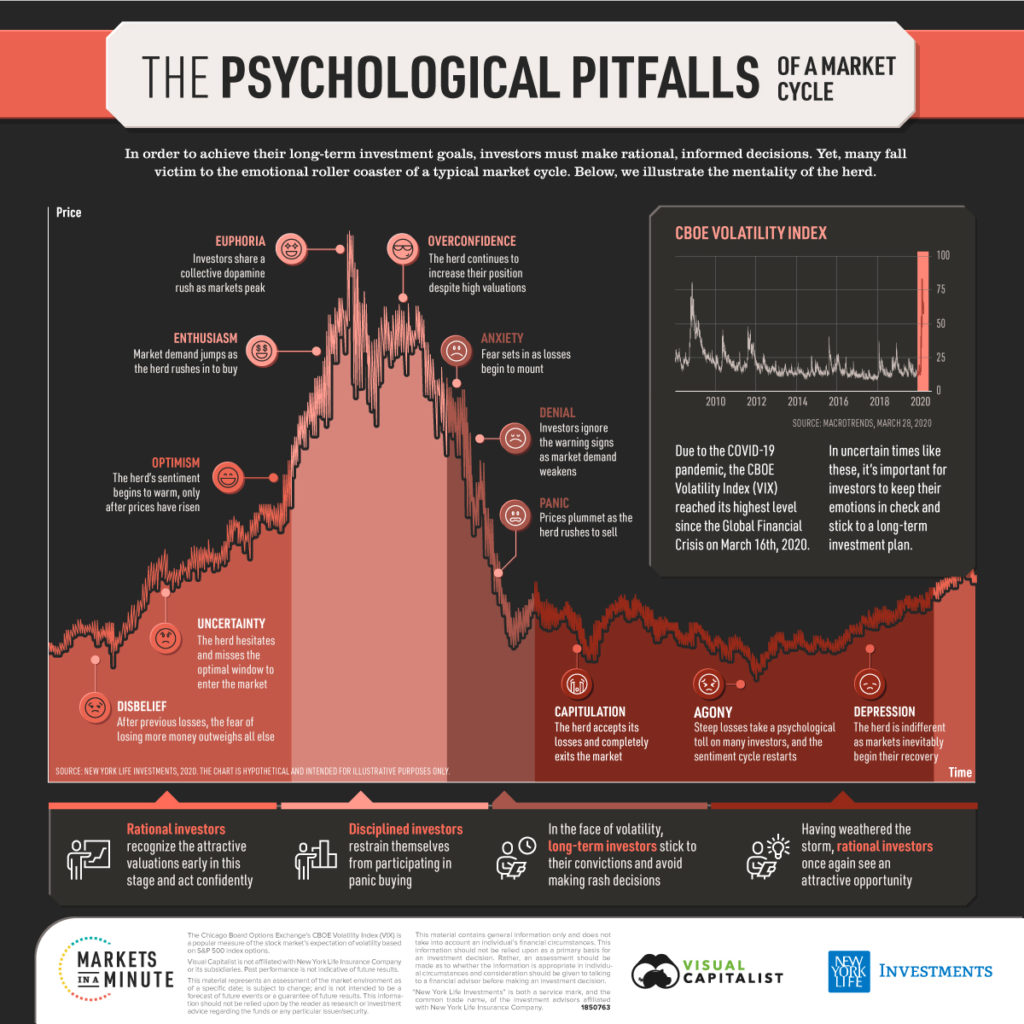
- Market Volatility: Uses the VIX and its 50-day MA to gauge expected volatility.
- Safe Haven Demand: Assesses the relative performance of stocks vs. Treasuries.
Each component provides a different lens into market psychology, making the index a well-rounded sentiment signal.
Beyond Equities: Crypto’s Emotional Thermometer
Sentiment matters just as much in crypto — sometimes more. That’s why Alternative.me developed the Crypto Fear & Greed Index, tracking similar dynamics:
- Volatility
- Trading Volume
- Social Media Momentum
- BTC Dominance
- Google Trends data
While crypto’s version uses a different methodology, the aim is the same: measure how emotion drives price.
Build It Yourself: DIY Fear & Greed Index in Python
Want to go deeper? Here’s a blueprint to calculate your own Fear & Greed Index using real data and Python:
Step 1: Gather Market Data
You’ll need historical data for:
- S&P 500 (momentum)
- NYSE high/low stats (strength)
- Advancing/declining volume (breadth)
- Put/Call ratio
- Bond yield spreads
- VIX index
- Stock vs. Treasury returns
Step 2: Normalize to 0–100
Use Min-Max scaling:
normalized_value = (raw_value – min_value) / (max_value – min_value) * 100
Step 3: Average the Signals
fear_greed_index = (avg_momentum + avg_strength + avg_breadth + avg_options + avg_bond_demand + avg_volatility + avg_safe_haven) / 7
Step 4: Interpret the Score
- 0–24: Extreme Fear
- 25–44: Fear
- 45–55: Neutral
- 56–75: Greed
- 76–100: Extreme Greed
Step 5: Python Quick Example
import random

# Generate random normalized values for each indicator (0 to 100)
normalized_momentum = random.uniform(0, 100)
normalized_strength = random.uniform(0, 100)
normalized_breadth = random.uniform(0, 100)
normalized_options = random.uniform(0, 100)
normalized_bond_demand = random.uniform(0, 100)
normalized_volatility = random.uniform(0, 100)
normalized_safe_haven = random.uniform(0, 100)

# Calculate the average of normalized values
average_momentum = (normalized_momentum + normalized_strength + normalized_breadth + normalized_options + normalized_bond_demand + normalized_volatility + normalized_safe_haven) / 7

# Calculate the Fear & Greed Index
fear_greed_index = average_momentum

# Interpret the index
if fear_greed_index <= 24:
    sentiment = "Extreme Fear"
elif 25 <= fear_greed_index <= 44:
    sentiment = "Fear"
elif 45 <= fear_greed_index <= 55:
    sentiment = "Neutral"
elif 56 <= fear_greed_index <= 75:
    sentiment = "Greed"
else:
    sentiment = "Extreme Greed"

print(f"Fear & Greed Index: {fear_greed_index} ({sentiment})")
This code generates random normalized values for each indicator, calculates the average, and interprets the Fear & Greed Index based on the score. In practice, you would replace the random data with real financial data to get meaningful results.
To create a Python script that fetches the Fear and Greed Index data from a reliable source, processes it, calculates the index, and plots it on a chart with automated updates, you can use libraries such as pandas, yfinance, matplotlib, and schedule. Here’s a step-by-step code example with explanations:
# Import necessary packages
import yfinance as yf
import pandas as pd
import matplotlib.pyplot as plt
import schedule
import time

# Define the function to fetch and process the Fear and Greed Index data
def fetch_process_fear_greed_index():
    # Define the ticker symbol for the Fear and Greed Index
    index_symbol = "^CNNFearGreed"

    # Download historical Fear and Greed Index data from Yahoo Finance
    df = yf.download(index_symbol, period="1y")

    # Clean the data (remove missing values)
    df.dropna(inplace=True)

    # Calculate a simple moving average (SMA) for the index
    window = 14  # Adjust the window size as needed
    df['SMA'] = df['Close'].rolling(window=window).mean()

    # Plot the Fear and Greed Index data and SMA
    plt.figure(figsize=(12, 6))
    plt.plot(df.index, df['Close'], label='Fear & Greed Index', alpha=0.7)
    plt.plot(df.index, df['SMA'], label=f'{window}-Day SMA', color='orange')
    plt.title('Fear & Greed Index and SMA')
    plt.xlabel('Date')
    plt.ylabel('Index Value')
    plt.legend()
    plt.grid(True)
    plt.savefig('fear_greed_index_chart.png')  # Save the chart as an image
    plt.show()

# Schedule the function to run daily
schedule.every().day.at("09:00").do(fetch_process_fear_greed_index)

# Run the scheduled tasks
while True:
    schedule.run_pending()
    time.sleep(1)
We begin by importing the necessary libraries: yfinance for downloading financial data, pandas for data manipulation, matplotlib for data visualization, and schedule for task automation.
The fetch_process_fear_greed_index() function is defined to retrieve and process the Fear and Greed Index. Within this function, we specify the appropriate ticker symbol representing the index.
Using yfinance, we download historical data for the Fear and Greed Index. We then clean the dataset by removing any missing values and calculate a simple moving average (SMA) as a basic analytical example.
Next, we visualize the Fear and Greed Index alongside its SMA using matplotlib. The resulting chart is saved as an image file (fear_greed_index_chart.png) and displayed.
To automate execution, we schedule the fetch_process_fear_greed_index() function to run daily at 9:00 AM using schedule.every().day.at("09:00").do(...).
Finally, the script enters an infinite loop (while True) that continuously checks for scheduled tasks and executes them at the specified time. A one-second sleep interval between iterations helps minimize resource usage.
This script automatically retrieves the Fear & Greed Index data, applies a simple moving average (SMA), and generates a daily updated chart. You can easily customize parameters such as the SMA window or schedule time to better suit your trading workflow or analysis preferences.
Final Thoughts: Sentiment Is the Shadow of Every Trade
The Fear & Greed Index isn’t magic — it’s a mirror. It reflects the collective emotional state of investors, giving you a chance to zoom out from the noise and identify extremes.
Use it not as gospel, but as a counterweight to your own biases. In a world where narratives often overpower numbers, this index helps re-center your perspective.
Because in the end, successful investing isn’t just about predicting markets — it’s about managing emotion when markets go manic.