How To Read Economic Data
Reading Economic Data and Understanding the Lingo
We want to fill a gap here. A lot of economic data is published day in and day out but yet most of us don’t really understand the lingo behind it. Let’s bring some clarity into this. Regularly we come across certain terms dealing with measures of economic activity. Most of them are pretty straight forward if you give it a chance. So let’s proceed with some of the more common concepts you will run across when analyzing economic indicators.
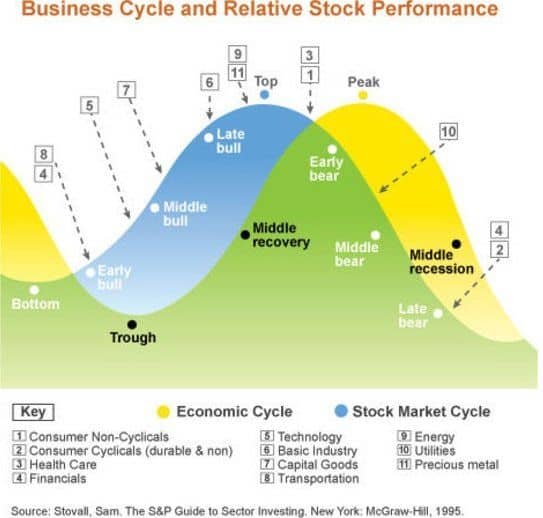
Business Cycle
At times the economy grows and then there are periods when the economy starts contracting. These swings from good to bad times and then back again are what we mean when using the term business cycle. The reason why these economic swings happen are only natural. An economy is a reflection of human behaviour and expectations. Occasionally businesses make mistakes that can have broader economic consequences. Sometimes households borrow so much that they have difficulties serving their debt. Results of such wrong decisions is that everything goes ballistic – 2007/08 housing bubble.
Fortunately the government has a set of tools to revive growth. For example lower interest rates, increase federal spending or tax cuts. The business cycle itself consists of five phases. The first phase is highest economic output achieved. After the peak comes phase two which is the recession itself. A very painful process where the economy starts shrinking. Such economic contractions can last 2 quarters or up to several years. The third phase is when we hit a trough. The fourth phase is when the economy resumes growth. Finally comes the fifth phase when the economy pushes above the previous high.
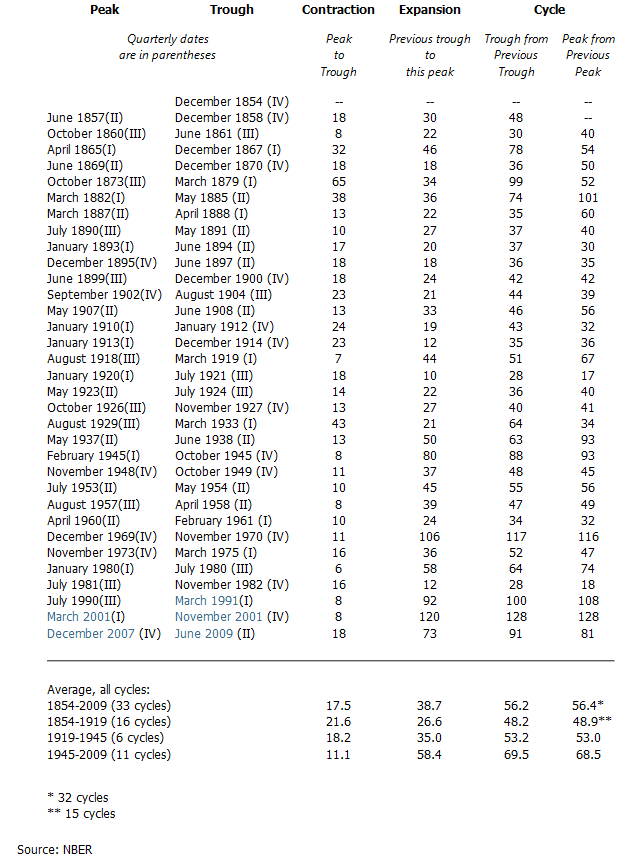
Now what do we mean by recession ? Economists declare a recession when there are two consecutive quarters of negative GDP growth. A caveat here, in 2001 for example the recession did not include two consecutive quarters of decline in real GDP. In the recession beginning in December 2007 and ending in June 2009, real GDP declined in the first, third, and fourth quarters of 2008 and in the first quarter of 2009. Several economic indicators need to be analyzed before coming to the conclusion that the economy is in recession mode.
The real experts when determining recessions are economists working for the National Bureau of Economic Research. According to NBER there have been 33 business cycles in the U.S. since 1845. The average recession was lasting 16 months. Since WWII we had 11 business cycles with recessions lasting for 11 months on average. The 2008 recession turned out to be the worst since 1945. For those of you who want to dig deeper into business cycles and cycles in general here is an excellent resource that we highly recommend.
Moving Averages of Economic Data
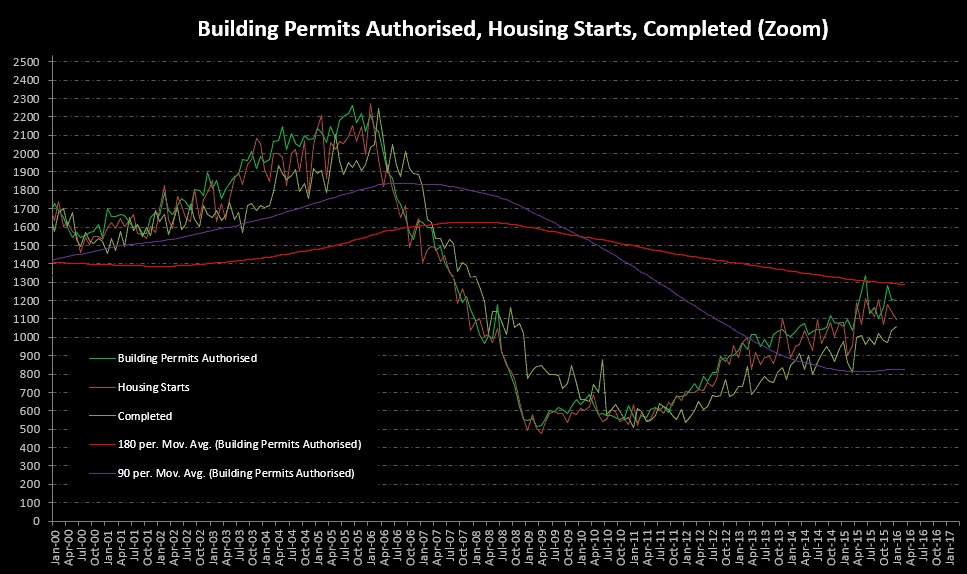
For some people it’s a great temptation to jump to conclusions about where the economy is heading from just one or two months of economic data. The economic releases are not a light on/off switch. Several indicators must be monitored and the readings must be consistent for more than two months. If an industry reports numbers that show a contraction we need several more readings that indicate contraction. A useful tool is to implement moving averages. Moving average computations average the data and can show us whats happening in the long run we then compare the average to current economic data. For example, let’s assume the CPI shot up in the recent month. A rise could get the alarm bells ringing but its wiser to look at the past three to six months. Moving averages are smoothing out the random fluctuations. Here is an example with building permits that gave us a better picture on the start of a recovery 😉
Benchmarks and Revisions
Everybody is looking for the latest economic data whether it’s a fund manager or trader. The more timely the information is released the more its impacting the market. Every agency has a strict release schedule and therein lies the problem. The fact that data has to be released quickly makes it often inaccurate. For that reason the first release of many economic indicators is not reliable and considered to be preliminary. After the first release the numbers undergo several revisions. Traders do not tend to look much into revisions but they should. New figures can affect economic forecasts in major ways. On the other side benchmark changes occur less often usually once a year. When government introduces new seasonal adjustment factors the benchmark revisions affect economic data going back five years and more.
Seasonal Adjustments
Let’s jump right into an example. In the spring when schools let out the number of people looking for a job surges. Students enter the workforce to earn money during the summer. Mid-August employment drops off as students leave the workforce. These fluctuations are where the seasonal adjustment process comes in. Government experts look at economic data going back five and more years. They observe patterns that depend on external factors such as summer/winter/holidays that have nothing to do with the business cycle. After observing those patters the officials come up with a formula that factors out variations in economic numbers attributable to seasonal changes.
Consensus Surveys
There are a lot of surveys that feature forecasts from experts on what an upcoming economic indicator will report. Deviations of the forecasts from the actual data tends to influence the markets. The bigger the gap between consensus and reality the larger the reaction in the financial markets.
Companies who put out these consensus surveys are Bloomberg, Reuters, Dow Jones and Consensus Economics. They produce surveys by polling economists for their predictions on upcoming economic indicators. The responses of those economists are averaged out and the data becomes the consensus forecast.
Annual Rates
A way to compare how fast an economy is growing is to measure the changes in activity. Changes are measured in annual rates. For example, the government reports, cars are selling at a 10 million vehicle annual rate. This number tells us how many will be sold if the last months pace is maintained for each of the next 12 months. To turn a monthly rate of data into an annual rate simply multiply it by 12. The annual rate tells you what will happen if that pace is maintained for 12 months.