The Curious Case Of Central Bank Balance Sheets
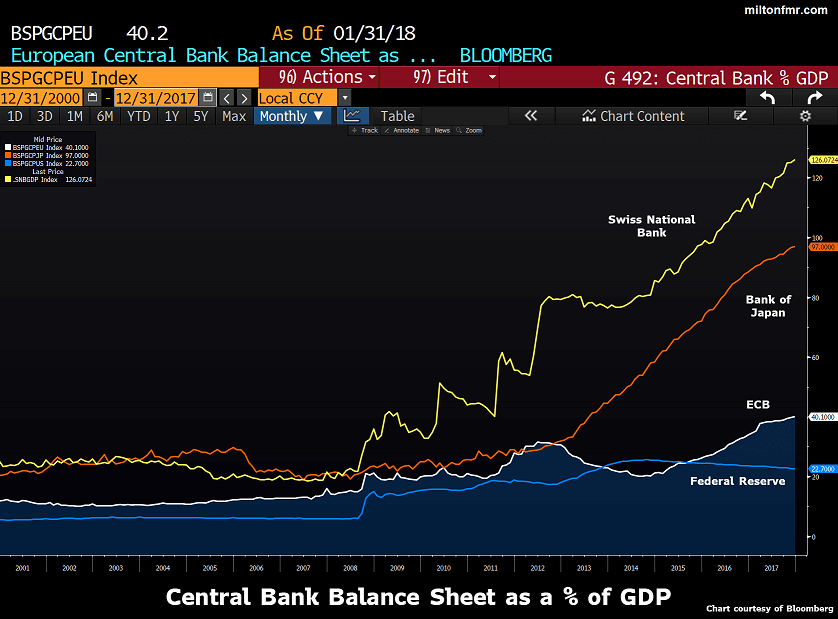
Was Jesse Livermore right when he said, “I learned early that there is nothing new in Wall Street. There can’t be because speculation is as old as the hills. Whatever happens in the stock market today has happened before and will happen again.” Basically, his statement is correct and anyway who would dare to question the market wisdom of this great investor. However, looking at central bank balance sheets it seems to be “different this time”. Never ever in the history of mankind, we had something like this :
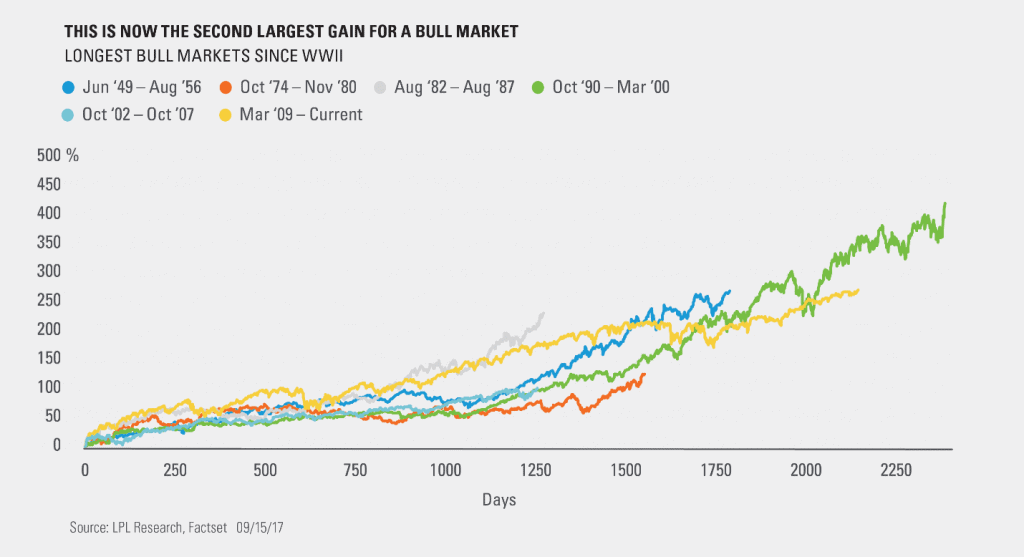
There are plenty of “market experts” who believe they know the cause of the next crisis. Reality is that nobody knows for certain. What we do know is that the next crash is not far away. The current market cycle is officially the second-largest bull market since World War II. The bull market is officially 106 months old. The logical question is: how much further can it go? We have an old bull market and an old expansion. When will the music stop? How long will the market dance to the tune of central bank policies? Fact is that we are in unchartered territory. Central banks around the world do not know how this QE experiment will end when the referee blows the whistle.
Since the financial crisis of 2008, central banks around the world have printed money like there is no tomorrow and purchased assets as an aggressive way to stimulate the economy. But no central bank in the world did it more than the Swiss National Bank (SNB) when it comes to buying assets especially foreign ones. What we can say with some degree of certainty is that the next crash will hit the Swiss economy pretty hard if they don’t hedge their delta.
The SNB invested 94% of its balance sheet outside of Switzerland. But it hasn’t just invested in normal central-bank investments like government bonds and similar vehicles. The Fed, for example, has 55% in US government bonds and 40% in mortgage-backed securities backed by government-sponsored enterprises. On the other side of the pond, we have the SNB that invested over 20% in equities, and more than 50 % of that in US equities. The SNB has a $90 billion portfolio of US equities, which equals about 0.3% of the US stock market. Voilà – the perfect exposure for a disaster to come. Good luck SNB with your experiment.
A Lesson In History
Central banks made mistakes before whether intentionally or unintentionally. Why should they stop with it know? One should not forget what mistakes have been made in the past. In the 1930s, for example, the deepening of the Great Depression was the result of major central banks being unable to fully grasp the consequences of debt deflation.
Breaking down debt deflation: A mortgage, which is a form of secured debt, presents a good example. Let’s say you purchased a home by taking out a mortgage. That same home would be secured as collateral for the loan, meaning that if you defaulted on payments to the bank, the home would be repossessed by the bank. If the potential selling price of the home decreased in value while you were still making payments to the bank, you would be in the middle of a debt deflation scenario.
Central Banks in the 1930s didn’t use their balance sheets enough in order to lower long-term interest rates. The result was an ever-growing cascading sequence of bankruptcies further accelerating the crisis. Whether central banks learned their lesson or not remains to be seen.
Let’s have a look at a central bank balance sheet in order to better clarify the different transmission channels and their interaction.
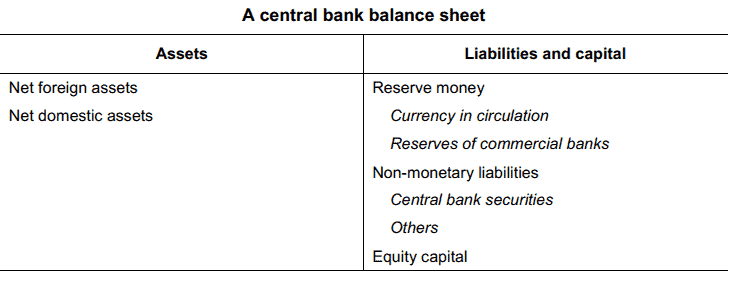
An accumulation of assets (SNB for example) implies an increase in corresponding debt. The purchase of domestic assets will directly affect their prices and therefore credit spreads. An increase in reserve money will have implications for banking sector liquidity, which may undermine price stability further down the road. On the other side, an increase in long-term liabilities could also reduce lending to the private sector. Considering the implications of these transmission channels it becomes quite clear that central bank balance sheets have implications for the real economy and the financial sectors. Observing history we can see that a large expansion of central bank balance sheets often (not always) resulted in high inflation.
Another important point to consider is that central bank balance sheet expansion in those countries closest to war was the largest in magnitude. In both Norway and France, central bank balance sheet size relative to GDP changed by 75 percentage points during WWII.
- Since 1900 balance sheet size relative to output has fluctuated within rather clearly defined bands most of the time. The exceptions are big expansions and contractions associated with periods of geopolitical (WWII) or financial crisis (post-2007 era).
- There is a high correlation between central bank balance sheet size and public debt relative to GDP.
- Central banks rarely reduce the size of their balance sheets in nominal terms after large expansion episodes. Reductions are predominantly achieved in real terms.
The Effect Of The Housing Market Crash 2007 On Central Bank Balance Sheets
The financial crisis that started to unfold in 2007 resulted in a loss of confidence in banks and many financial products. This occurred because the modus operandi of financial markets became impaired. Lower policy rates did not create the ripple effect down to the real economy. Central banks countered this by buying unconventional assets. It became effectively the go-to tool for preventing another financial meltdown. With short-term rates near zero, these policies sought to provide additional monetary stimulus. The result is that they prevented the next financial crisis by creating an even bigger bubble. The mother of all bubbles. We are edging slowly but surely into a …..