
Analyzing Economic Indicators

EMPLOYMENT SITUATION REPORT
Market Sensitivity: Very high.
What Is It: The latest unemployment rate.
Home Web Address: www.bls.gov
Release Time: 8:30 a.m. (ET); announced on the first Friday of each
month..
Frequency: Monthly.
Source: Bureau of Labor Statistics, Department of Labor.
Revisions: Revisions often go back two months with each release.
The employment situation report has a huge effect on stock and bond markets. The report is released in a timely fashion. It’s a detailed report with information about job market and household earnings. Household spending accounts for more than two-thirds of the economy’s total output. The report often contains surprises and is difficult to predict for economists. The highlight is the unemployment rate which is the percentage of the civilian workforce that is unemployed. Civilian workforce is anyone 16 years or older who is classified as either employed or unemployed. Monthly changes in the job market are measured by a household survey(60.000 homes) which the government conducts by telephone and an establishment survey in which companies are directly queried about changes in staffing.
From the household survey we get the unemployment rate. The survey includes farm, non farm workers, domestic helpers, residents who commute to jobs outside of the country and self-employed. Response rates are at about 95% and interviews are done in the week that contains the 12th day of each month or a few days later. Among the unemployed the government includes only those who are looking for a job. Individuals who actively have been looking for a job in the preceding four weeks. Persons who do not look for a job anymore can be found in the employment report published as separate unemployment rate. The household survey breaks down the population of those who have jobs and those without a job by age, ethnicity, education, sex and marital status.
The establishment survey is considered to be the better employment measure therefore it gets the biggest attention by market participants. The BLS gets in touch with over 400,000 corporate and governmental work sites. Information is obtained by telephone and mail. About 70% of the responses make it back in time. As additional responses arrive the survey is revised in each of the next two months. The Survey includes non-profit groups, non-farm businesses, local, state and federal government offices. Groups that are excluded are farm workers, domestic help and self-employed. One of the most important statistics is the number of new jobs formed or lost in the latest month. There is also a breakdown by geographic location and specific industry (more than 500 different industries). Keep in mind that both surveys can diverge. The reason for that is they probe the job market from different perspectives. If for example an individual has two-part time jobs the household survey counts that as one employed person while the establishment survey counts it as two jobs. Nevertheless in the long run both reports move in tandem.
The first section of the employment situation report show us an important number – the participation rate. This number tells us what proportion of the entire working age population is working or prepared to work. This ratio is followed very closely since we want to see people working or at least people looking for a job. In a typical business cycle the participation rate rises when the economy is growing. On the other side a falling participation rate signals a flattening economy.
Another important metric is the employment-population ratio that tells us if the economy is generating enough new jobs for a growing population. A rising employment-population ratio means that companies are hiring at a pace fast enough to keep up with the growing population. If we go back to 2008 we can see that the employment-population ratio slipped to 60% and remained there for the next few years. By monitoring this ratio we can foresee shifts in the job market and the strength of the economy. During the 1990/91 recession the jobless rate turned higher more than a year before business activity turned down. The unemployment rate bottomed in the 2001 recession 11 months earlier. We have observed a similar pattern in 2008. We can conclude that this indicator has an impact on the economy with a time lag of 6 to 12 months.
Establishment Data
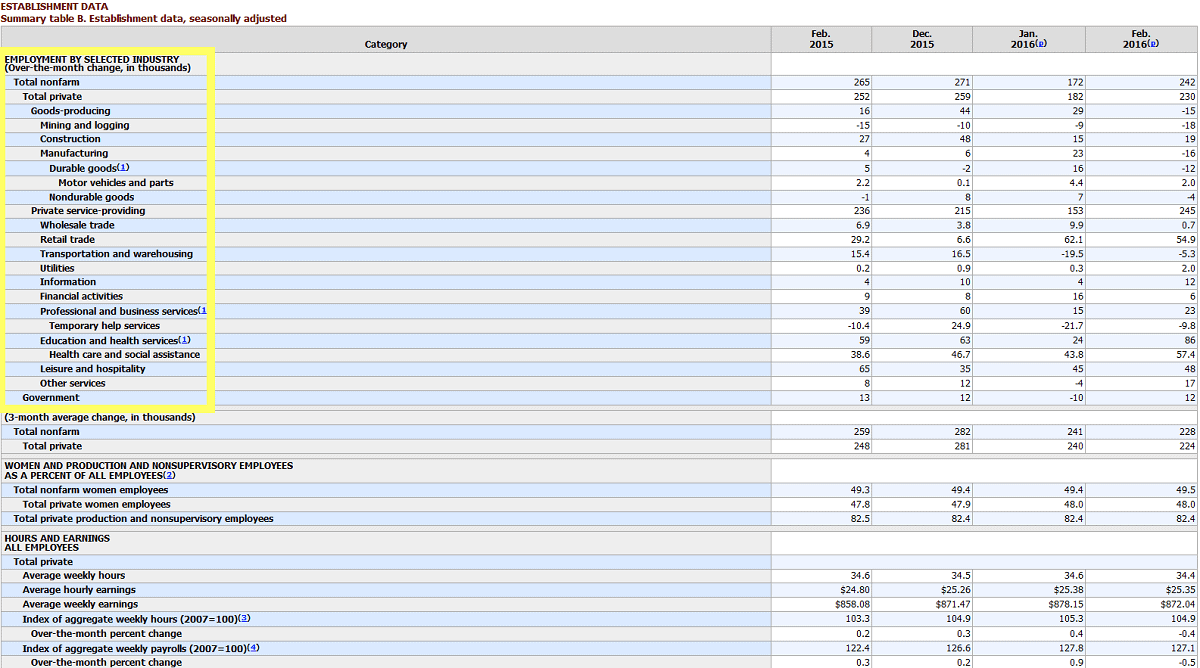
When it comes to the part of the data that creates the highest volatility in the markets than its the monthly change in non-farm employment. This is the key data that represents the evidence whether the country is creating jobs or not. A caveat when analyzing the numbers., if we want to get a clue whats happening in the private business sector one has to subtract the government’s contribution from the equation.
When we look at the average weekly hours and earnings we should look at the part of the employment situation report which looks at pay by selected industries. Rising earnings can reveal those industries that are doing well. Combine this with the ISM PMI and you will get a constant stream of new trading ideas that can be exploited.
Average Weekly Hours and Overtime of All Employees on Private Non-Farm Payrolls by Industry
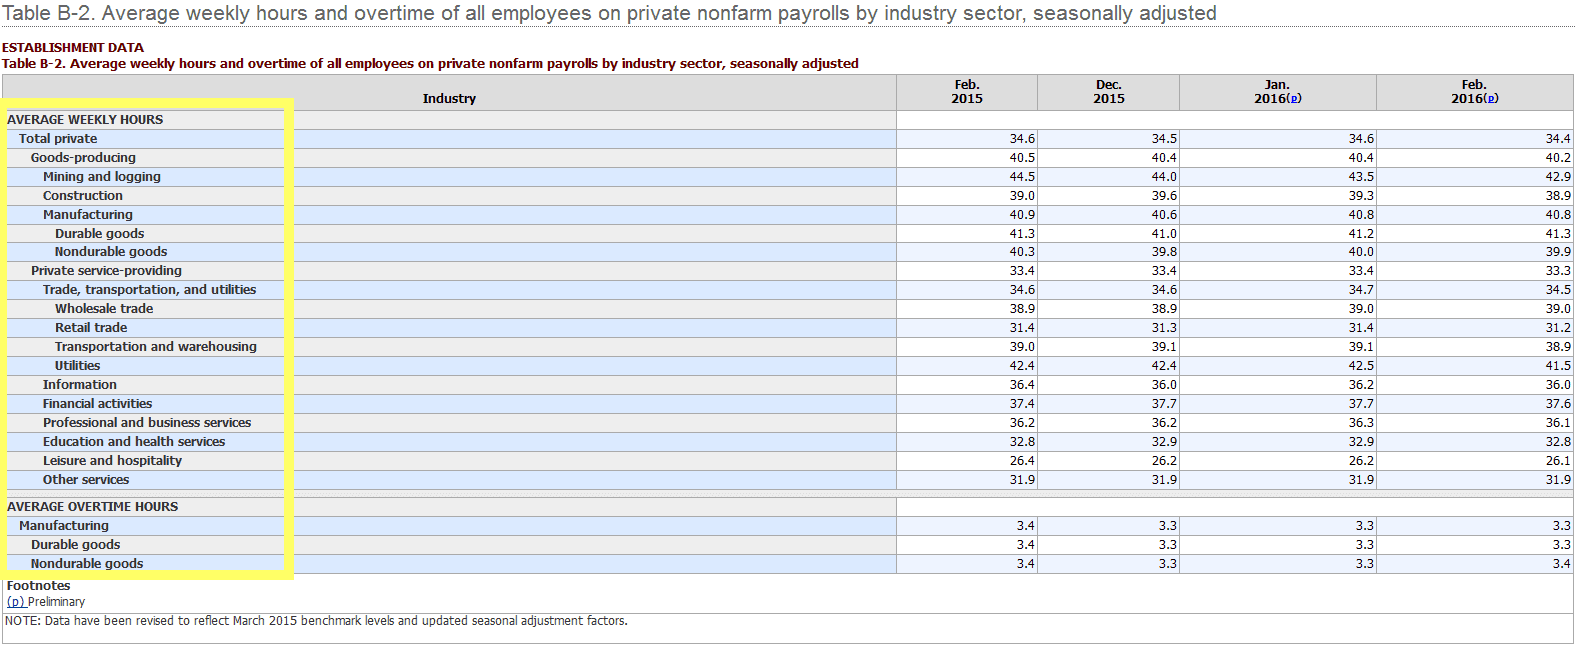
Another important number are the changes in average hours worked in a week. It is an advanced indicator of future economic activity. It correlates with the GDP. Generally speaking if the number of hours worked increases for three consecutive months it’s a strong sign that companies will soon increase hiring. The number of hours worked in manufacturing is sensitive to shifts in public demand for goods. When averaging weekly manufacturing falls below 40 its a good indicator that the economy is struggling. 40.5 hours and more suggests that business activity is increasing. During the course of history average hours worked in manufacturing ranged from 38.5 recession level and 41 hours which indicates strong growth. Among those numbers you also can see the average weekly hours worked for several different industries giving us a clue about sector performance. For example if the hours in the construction industry drop it could lead to falling housing starts. Falling housing starts cause higher unemployment in the real estate sector. If you are into buying home building stocks you should watch these numbers carefully.
During times of economic turbulence companies might give their employees extra hours to work. If these numbers increase for three consecutive months companies will be under pressure to hire more staff. Readings above 3.3 are consistent with new hirings. Weekly manufacturing overtime normally fluctuates within a range of 2.1 and 3.5 hours. If it slips below 3.0 hours a week for a few months, layoffs might increase.