Mastering Mean Reversion Trading: A Guide to Identifying and Capitalizing on Range Bound Formations
The following system will help you identify range bound formations and determine optimal entry and exit points for such trades. Range bound formations occur when prices oscillate between established levels of resistance and support, forming a repetitive pattern of highs and lows. One key characteristic of these patterns is the diminishing trading volume. In this article, we will delve into the statistics and precise definitions of range bound patterns for 15-minute price intervals.
| Breakout % | Breakout ATR | Flag pole height % | Flag pole ATR | Pole duration (bars) | Flag duration (bars) | Breakout duration (bars) | ||
| Average | 4.8% | 10.1 | 4.5% | 8 | 14 | 8 | 49 | |
| Median | 4% | 8.1 | 3.3% | 8 | 13 | 6 | 43 | |
| 90% percentile | 9.7% | 16.2 | 8.7% | 10.6 | 23 | 15 | 97 | |
| 10 % percentile | 2% | 4.5 | 2% | 5.6 | 6 | 3 | 15 |
In all patterns analyzed, the average duration was approximately 2 hours within 15-minute intraday bars. The average breakout lasted 1.98 days, with 90% reaching the target within 3.19 days. To measure the breakout and pole pattern, we utilized the average true range (ATR) as an indicator of price volatility.
Determining Profit Targets: We calculate the profit target using Pearson’s correlation coefficient between the breakout and the pole height, represented as a percentage of the average true range. The profit target (Pt) is derived from the formula: Pt = V * P, where Pt denotes the profit target, V signifies volatility, and P represents the pole (expressed in percentage terms). In our backtest, we included more volatile stocks with frequent breakouts. With a volatility value (V) set at 1.2, the profit target amounts to 120%. For instance, a 5% range bound pattern would yield a profit target of 6% above the range’s high, calculated as 0.5 * 1.2 = 0.6. Remember, the profit target is dependent on the asset’s volatility. To calculate the most recent beta values for stocks, you can refer to relevant resources. For blue-chip stocks, V values between 1.0 and 1.3 typically represent reasonable profit targets.
Identifying Range Bound Patterns and Defining Strategy Rules: To identify range bound patterns, we rely on the statistics provided in the above table and establish the following strategy rules:
- Steep range bound formations measuring at least 5.5 times the average true range (ATR) within 23 bars or less.
- Flag breakout occurring within 15 bars or less from the pole, with a slight downward slope.
- Flag depth not exceeding 2.5 times the ATR, measured from the highest high to the lowest low.
- Presence of an uptrend during the last 70 bars, leading to the formation of the pole pattern.
- Increased volatility during pattern formation.
Exit Conditions: To account for various exit scenarios, our strategy incorporates five exit conditions:
- Profit target set at 1.2 times the pole.
- Stop loss activated if the breakout occurs below the support line.
- Trailing stop implemented to preserve unrealized profits. The stop triggers if the difference between the highest value in the preceding five-bar period and the current bar exceeds three times the 40-bar ATR.
- “No change” exit condition triggered when the price breakout falls below four times the ATR. This stop activates if the position is held for more than 70 bars.
- If none of the conditions are triggered, the trade is terminated after 100 bars from the entry.
Optimization and Backtesting: Depending on the set of assets, backtesting should include optimization of parameters for stop loss, trailing stop, and the “no change” exit condition. To illustrate the implementation of the strategy, here is the TradeStation code:
https://gist.github.com/18182324/83605f58473496cbd49c78398aecd89a
The time frame tested was from November 30, 2009 until March 30, 2020. Other parameters we considered were commission per trade $5, Initial Capital $100,000, Interest Rate 2% (you wish), entire order is filled when trade occurs at limit price or better. Backtesting the strategy for ticker: AAPL with no optimization run we got following results:
| Description | Long Trades |
| Total Net Profit | $10,011.00 |
| Gross Profit | $25,365,00 |
| Gross Loss | ($15,354.00) |
| Total Number of Trades | 246 |
| Percent Profitable | 49.19% |
| Avg. Winning Trade | $209.63 |
| Avg. Losing Trade | $40.70 |
| Return on Account | 722.82% |
| Max Equity Run-up | $11,219.00 |
| Avg. Bars in Winning Trades | 61.62 |
| Avg. Bars in Losing Trades | 32.79 |
| Largest Winner as % of Gross Profit | 4.86% |
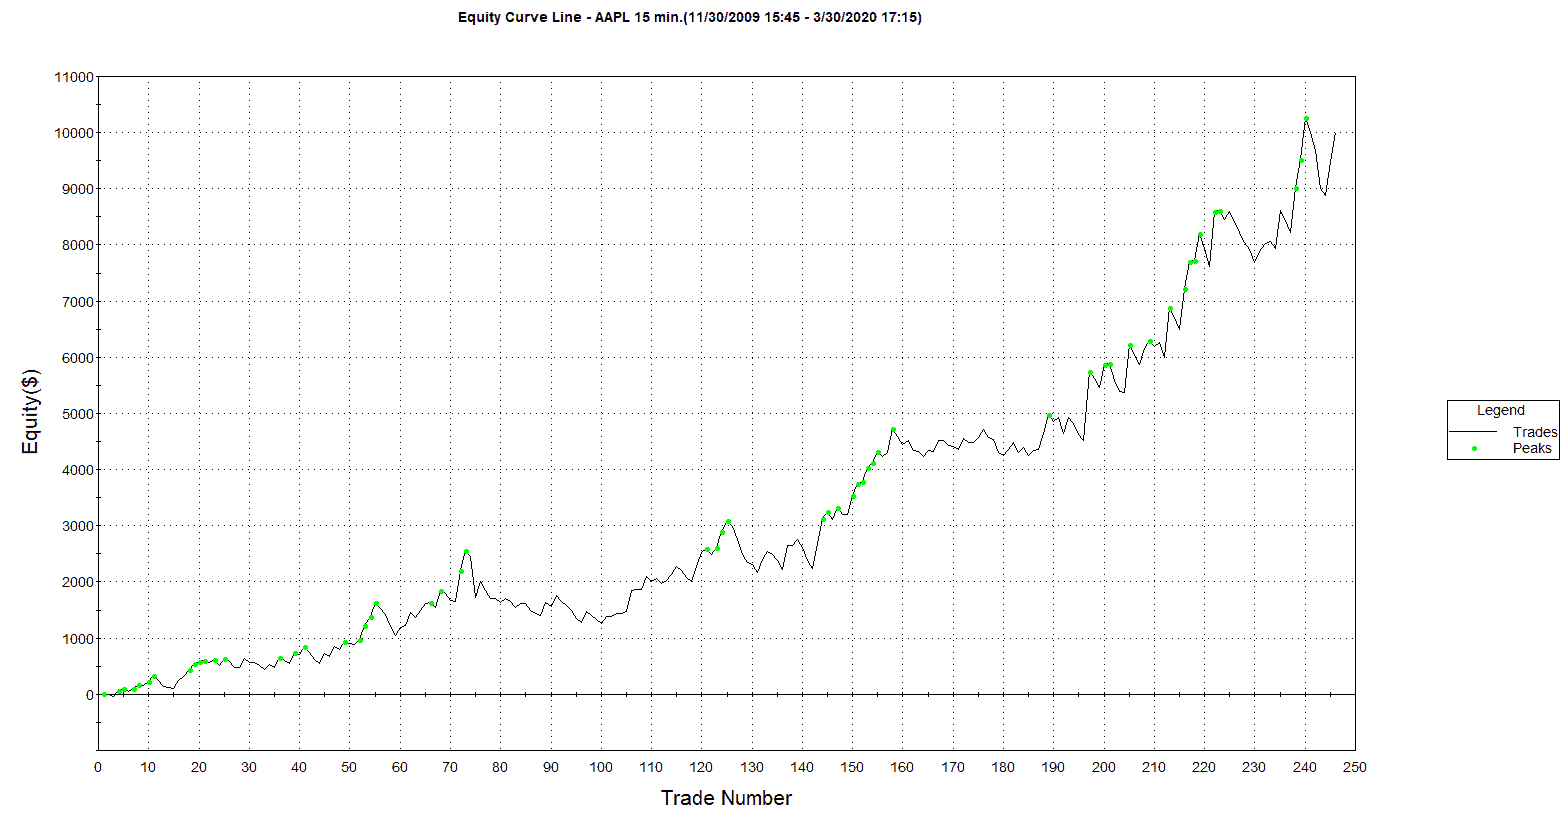
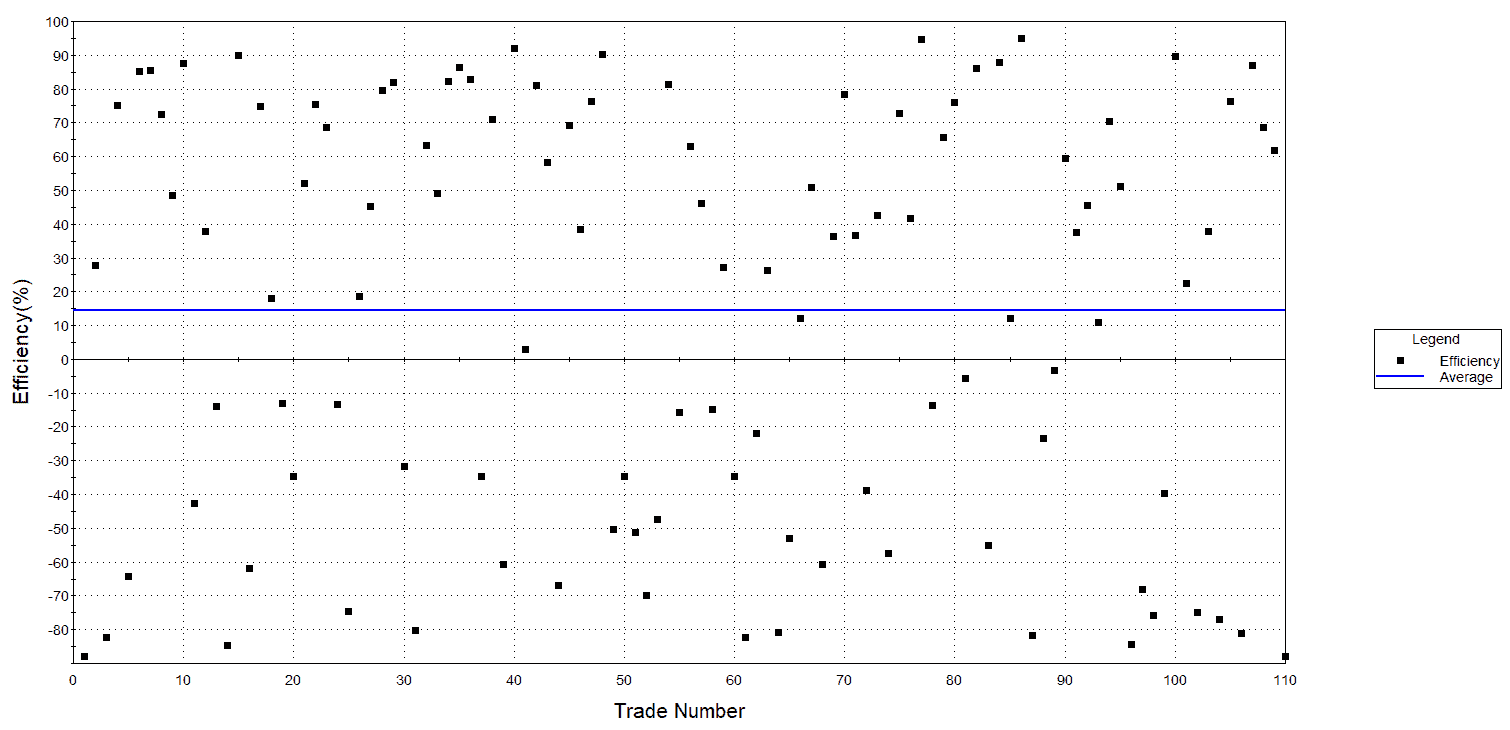
Despite not optimizing any parameters, the test results demonstrate a profit factor of 1.65. Winning trades lasted an average of 3 days and 7 hours, while losing trades averaged 1 day and 14 hours. The average time between trades was 12 days and 19 hours. The largest winning trade amounted to $1,233, while the largest losing trade incurred a loss of $733. Notably, our trading system was active in the market for only 16.04% of the time, reducing market risk.
Considering Additional Assets and Optimized Parameters: Flags are more likely to form in a bull market than in a downtrend. It is advisable to include an additional indicator in this strategy to assess the current market condition. Our test results indicate that out of the total 246 trades, only 25 were exited due to inactivity. Most unsuccessful trades were a result of market noise and heightened volatility. Therefore, it is crucial to optimize or adjust stop loss parameters continuously based on market volatility. For further analysis, we tested the strategy on AMZN, resulting in a profit factor of 1.6.
Expanding to Different Assets: Testing on S&P 500 Index Futures: To determine the strategy’s efficacy across different assets, we conducted tests on S&P 500 Index futures. Since trading an asset with a different volatility regime necessitates adjustments, we optimized the following parameters: MAXFLDUR (max flag duration), FLAGMIN (max average true range at the lowest point in the flag), and PX (max pole duration). After 1980 optimization runs, we obtained the following test results:
| Description | Long Trades |
| Total Net Profit | $31,300.00 |
| Gross Profit | $126,837,00 |
| Gross Loss | ($95,537.50) |
| Total Number of Trades | 580 |
| Percent Profitable | 50.00% |
| Avg. Winning Trade | $437.37 |
| Avg. Losing Trade | ($339.99) |
| Return on Account | 537.34% |
| Max Equity Run-up | $37,750.00 |
| Avg. Bars in Winning Trades | 61.47 |
| Avg. Bars in Losing Trades | 31.51 |
| Largest Winner as % of Gross Profit | 2.52% |
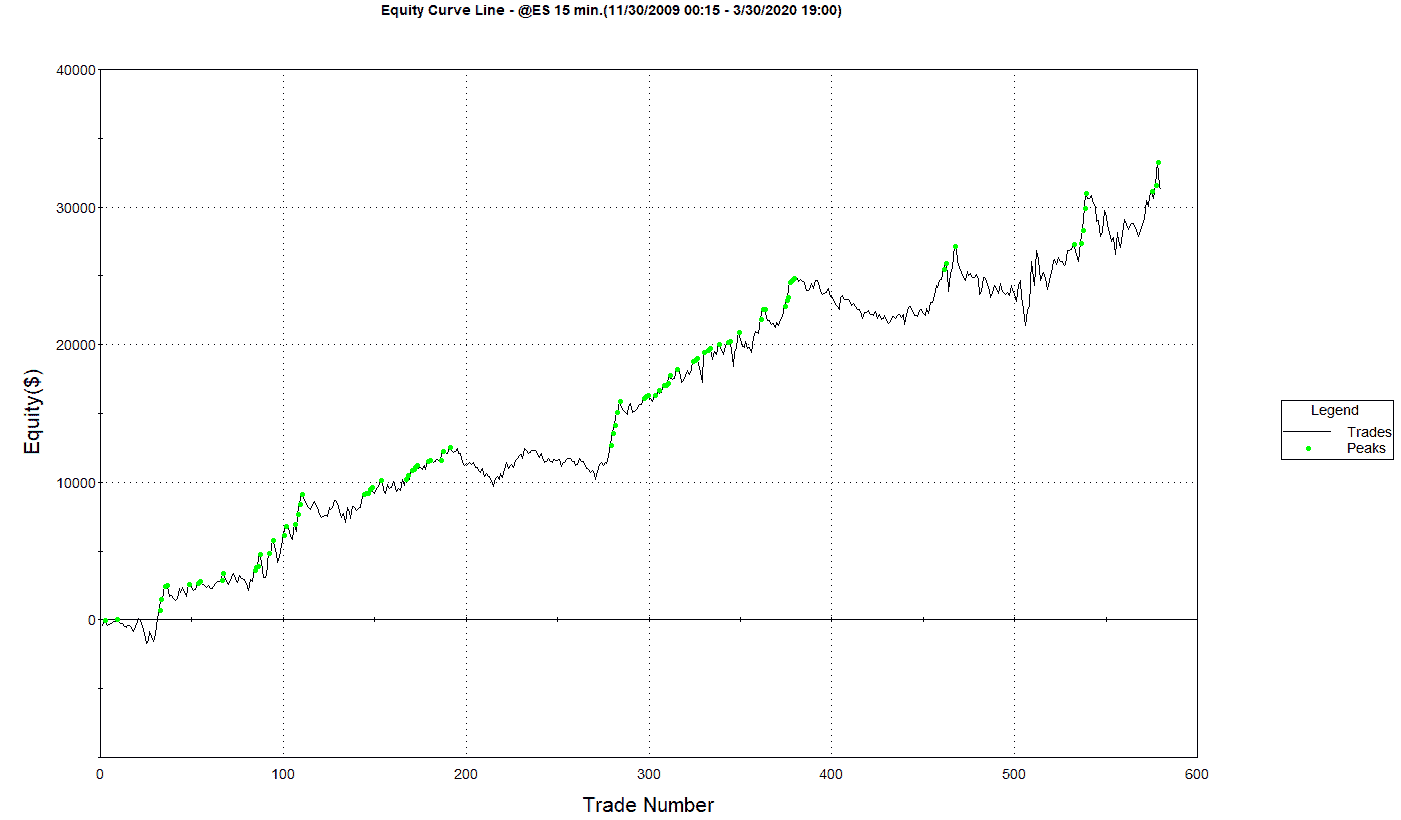
By optimizing the parameters [MAXFLDUR=12 FLAGMIN=3.25 PX=12], the profit factor reached 1.33. Winning trades lasted an average of 23 hours and 23 minutes, while losing trades had an average duration of 12 hours and 14 minutes. The average time between trades was 5 days and 18 hours. The largest winning trade amounted to $4,087.50, while the largest losing trade resulted in a loss of $2,312.50.
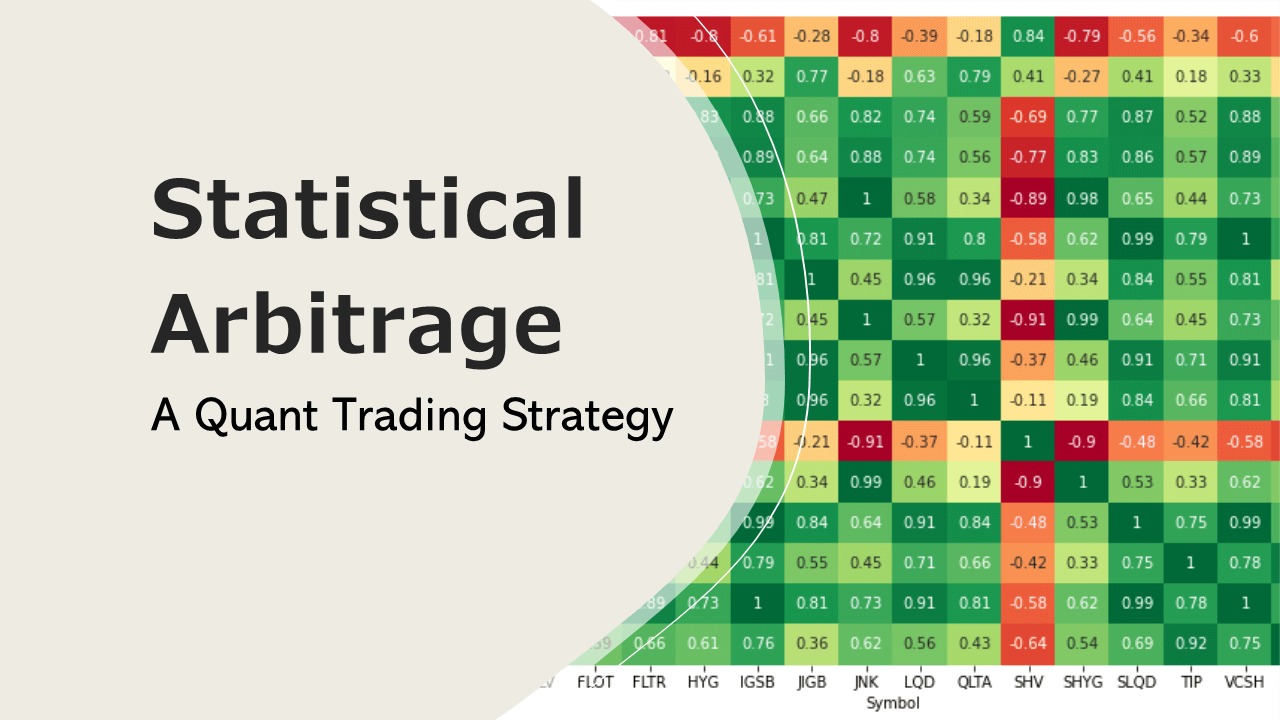
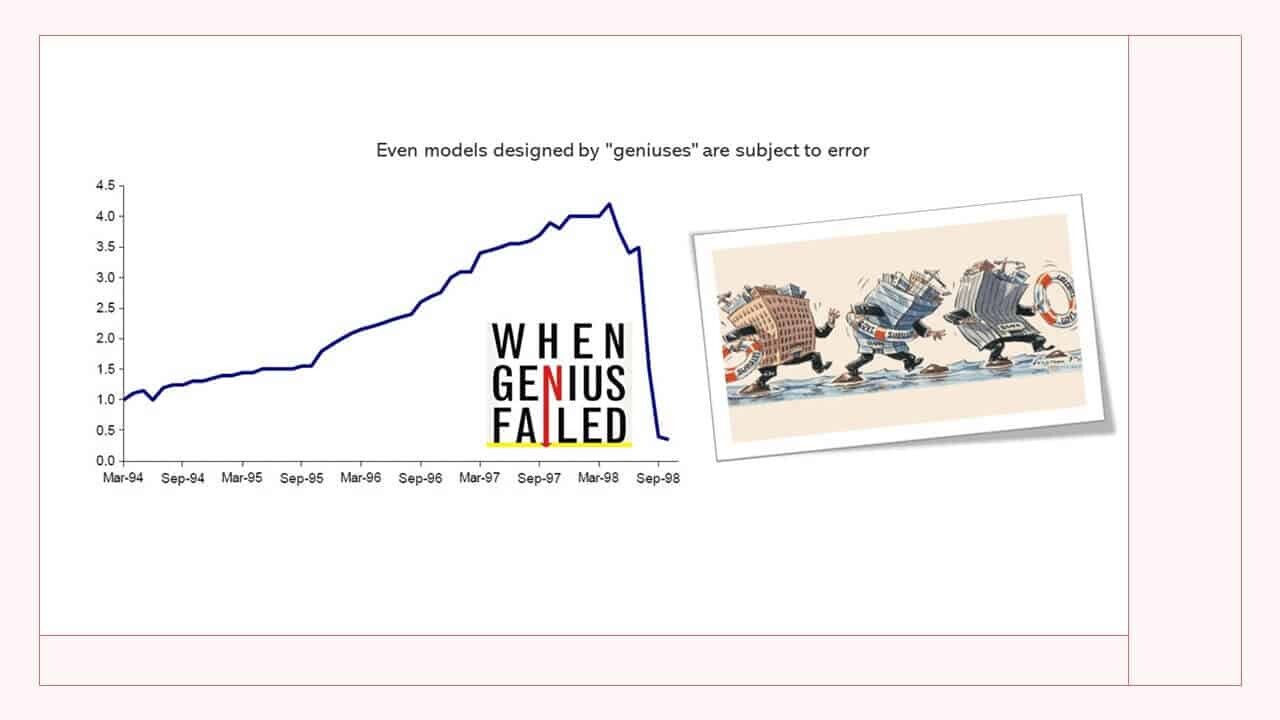
Considerations for Basket Trading: When backtesting a basket of stocks, it is essential to utilize non-correlated assets to reduce market risk. Often, traders overlook this aspect when simultaneously trading different assets. Neglecting to evaluate risk properly can lead to flawed portfolio designs that are susceptible to significant losses, such as those associated with Black Swan events. Including non-correlated assets is crucial for portfolio diversification and risk management.
Conclusion: Mean reversion trading, with a focus on range bound formations, presents opportunities for identifying profitable trades. By analyzing statistical patterns, implementing well-defined strategy rules, and optimizing parameters based on market conditions, traders can enhance their chances of success. However, continuous monitoring and adjustments are essential to adapt to changing market dynamics. Remember to include non-correlated assets in your portfolio for effective risk management.
For more comprehensive research, trading strategies, and programming in R, Python, and EasyLanguage, sign up here. [We publish trading strategies & research using R, Python and EasyLanguage]