The Fine Art of Opening Range Breakout Trading and How to Master It
Opening Range Breakout Trading Strategy Design and Implementation
The goal of this research is to find various set-ups and exit strategies that could be used for trading the opening range breakouts. The time frames we will be looking at are 10min, 15min and 30min opening range breakouts. We will focus our attention on the very liquid futures markets in particular we will analyze the S&P500 futures. We would like to encourage you as the reader to participate in the discussion and share your knowledge and/or ideas about opening range trading systems.
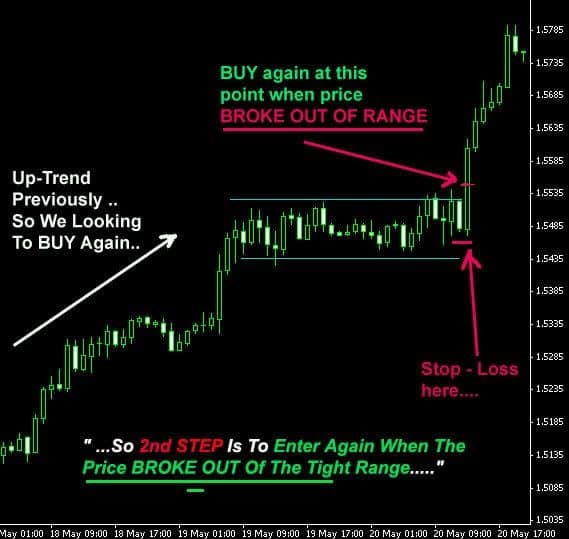
Our research is focused on a popular trading principle called the opening range breakout. We define that range as the first n-bars of minutes of a trading day. Isn’t the electronic futures market trading almost 24 hours a day ? Yes, but we use the NYSE opening time 9:30 a.m. ET . The logic behind this is when the NYSE market opens we have the highest trading volume. Especially during the first 15 minutes of trading. What makes the opening range an important trading concept is like we said the volume and the fact that traders act in response to recent news. The fact that important economic news are often announced at 10:00 am makes it even more significant. The trading crowd takes positions before the economic news are announced and not at the time it’s announced. Some analysts even claim that about 35% of the time the high or the low of the day occur within the first 30 minutes of trading. Our analysis will show if this argument holds true.
The aim is to identify possible set-ups and exits that can help us in improving the opening range breakout trading system. The set-ups tested include volume spikes, time and volatility. The tested entry and exit strategies will be analyzed and explained.
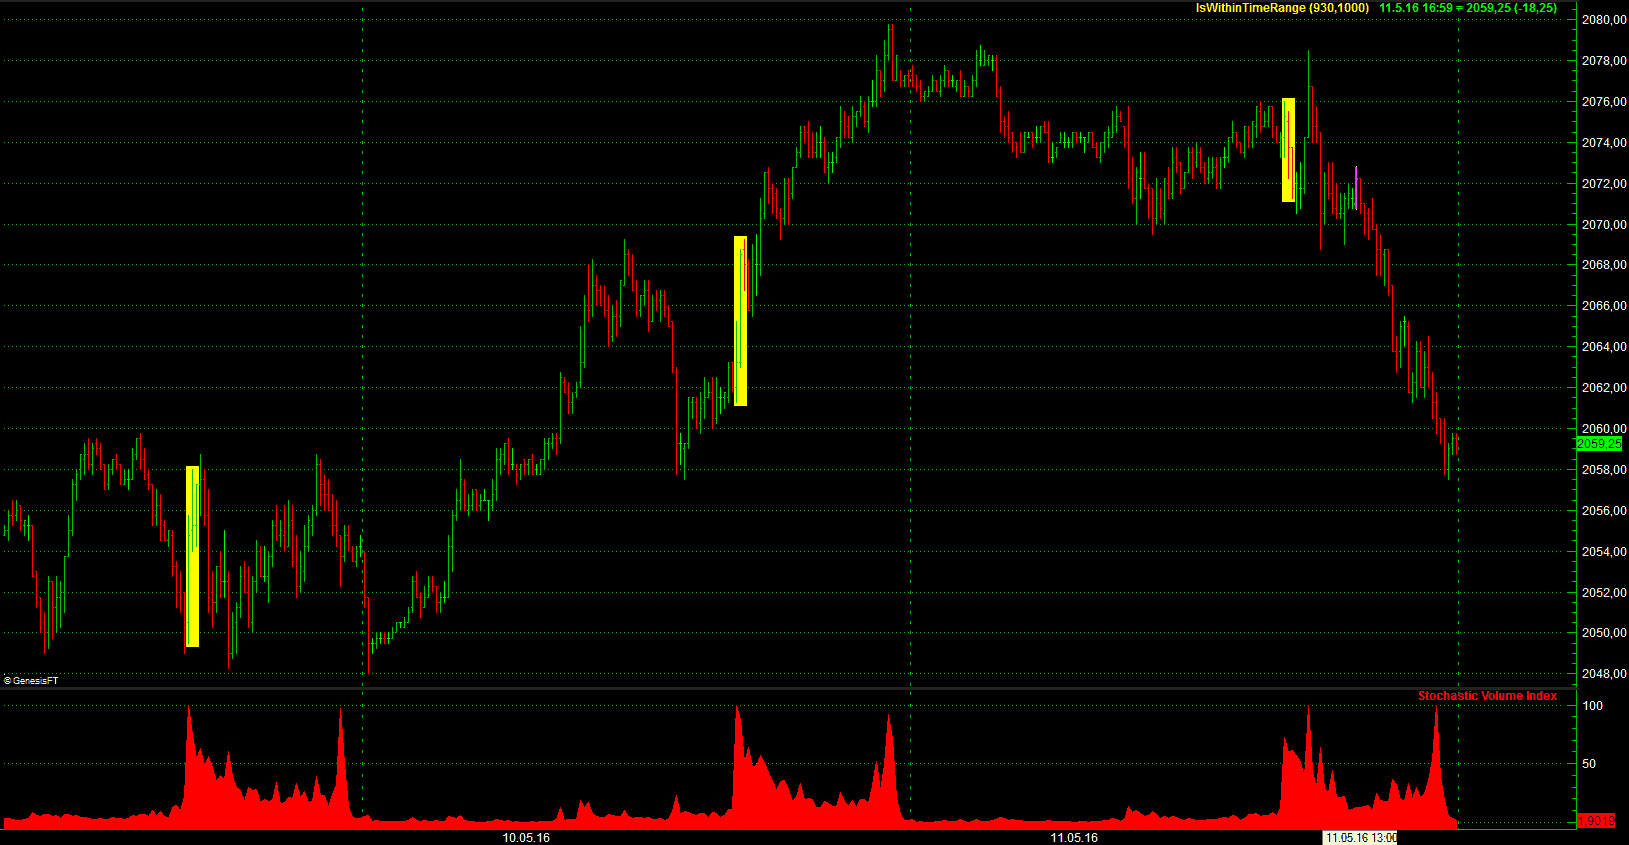
How about price and volume ? A very important indicator is volume. Therefore we must analyze the volume too and add it to our trading arsenal. The reason why you should use it is that high volume is an indication of high commitment to a position. The opposite is also true, if the price increases on low volume it indicates that the price is likely to retrace. For the better understanding of the trading volume on a particular day we will use a Stochastic Volume Index Indicator (compare the volume today with the volume of the last couple of trading days). The current value is expressed as a percentage between the lowest and highest that it has been over the previous X number of bars. The numbers will be between 0 (when at the lowest) to 100 (when at the highest). We calculate the value by using the close of each bar. When done correctly it should look like this :
When looking at the sample graph above you can already see why the opening range is so important. Highest volume between 9:30 am and 10:30 am. Thereafter it dries up and we have one more spike right before the close of the trading session 15:45 am till 16:00 am. Every day the same game.
To analyze the opening range breakout we have to understand the dynamics behind it. It is the time frame with high volatility and high volume because the traders had time to analyze the previous trading day’s price movements. If the trend direction of a trading day is determined by the first two bars of the opening range, wouldn’t it be useful to compare the last trading day and the opening of the current trading day to see if we have an opening gap ? The assumption is that a gap up day should further increase our confidence when trading the opening range. A gap up tells us traders are already going long and we had a lot of unfilled orders the previous day which are executed at the opening. This further underpins a bullish trend. Let’s see if this assumption is correct.
Strategy Rules:
- First bar of the day > Close of the last bar of the previous trading day, Entry on the close of the third bar after the opening range breakout(time frame 10 min. bar period, two consecutive bars up), Full Gap Up = 11 Ticks(First bar of the day is 11 Ticks higher than the last bar of the previous trading day, Stop Loss $600, Exit at the Close 16:00 pm, Slippage $50.
- Long entries are made at a 11 ticks above the gap open and trades only once per day. The number of ticks above/below the gap open can be optimized for each of the entry rules. We have optimized the long entry by testing the tick range from 1 to 15.
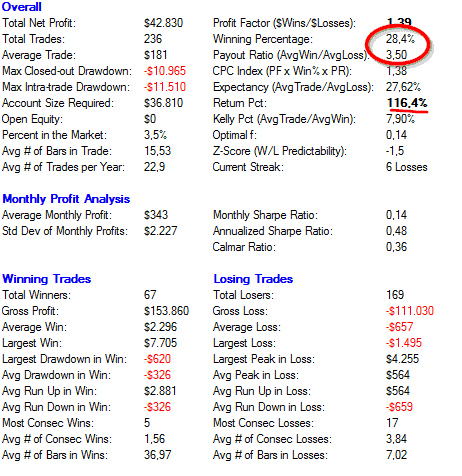
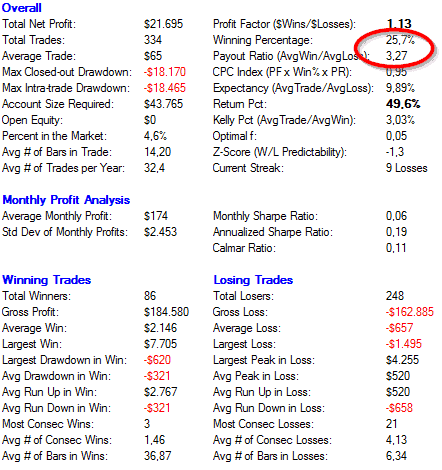
The winning percentage is low but the Payout Ratio of 3.50 looks promising. You remember what we tried to proof ? “35% of the time the high or the low of the day occur within the first 30 minutes of trading and it dictates the direction of the trend for the rest of the day” Looking at our test results we are quite close. Our results indicate that in about 30% of the time the opening range dictates the trend direction for the rest of the day. Obviously the results can be improved by fine tuning our exit technique. For now we went with the exit rule “exit at market close” for the sake of simplicity. When we analyze the trading results by trading day of the month we have the strongest gains during the first week of the month. Why ? What we know from the world of investment banking (in Europe) is the fact that insurance companies and funds have a cash inflow during the last days of the month and they invest the new cash within the first five trading days of the subsequent month. This is just our interpretation. If you have another clue or a better explanation we are curious to read your comments.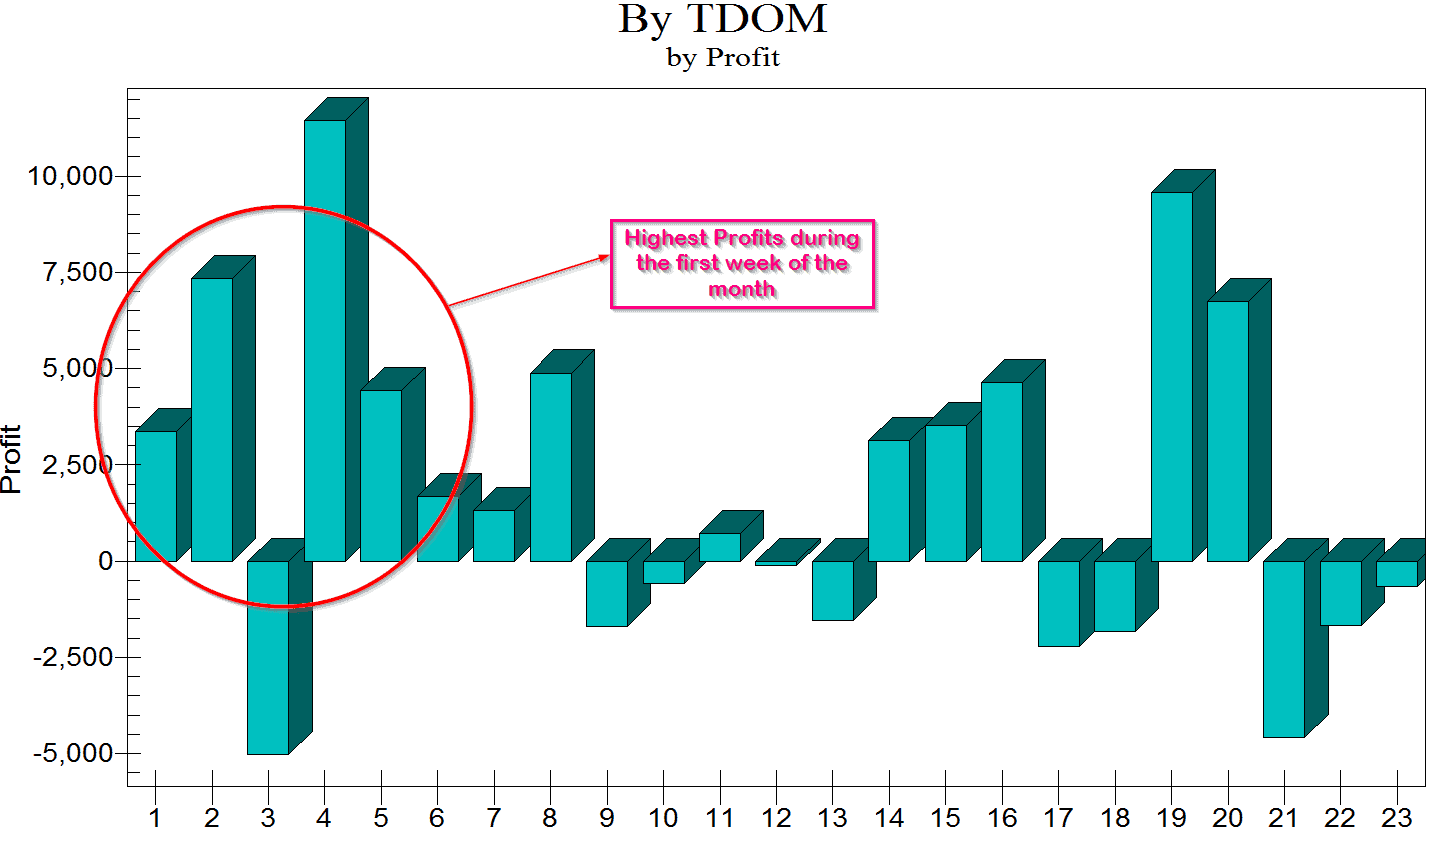
What if we test only the breakout without the gap up day. Strategy rules are the same as above with the exemption that we do not need a gap up day to enter the trade.
Results:
The overall percentage comes down to 25.7% which is not a big difference. The return percentage of 49.6 % is lower which can be explained by the fact that we have entered 98 trades more than with the previous setup and the overall volatility on trading days with no gap is slightly lower. The Kelly Pct. is 3.03% which is way too low. Adding the market opening gap as an additional set-up for our trade entry improves the Kelly Pct. to 7.90%. When money management rules are applied to the trading strategy the final result of our alpha increases tremendously.
Strategy Development Steps
- Set-up : We define a condition that needs to be met before we consider entering a trade. The set up is a filter which tells us when the odds are in our favor but it’s not telling us when we should enter the trade. We will use the Stochastic Volume Index Indicator described before.
- Entry: This is obviously the signal that gets us into the market. It confirms our set up and tells us when to enter the market. We will use the range breakout entry technique described before.
- Exit: A very important part of our trading strategy performance and also the most difficult one. We will experiment with different exit techniques as we write this article.
- Money Management : We will use the Kelly Criterion.
- Position Sizing : This determines the number of contracts you should trade at any given time. You adjust your position sizing after carefully analyzing your winning trends. For example, after 3 consecutive losses what is the probability that the 4th trade will be a winning trade.
- Optimizing: Always fun to do but a double-edged sword. Many traders tend to over optimize the strategy. This is a dangerous game to play.
Yes, the combination of set-ups can be endless and the process of successful system design tiring. This is why you should use the above steps when developing your trading strategy and when trying to find a good set-up you should apply some common sense. We cannot test everything for you but we will give you some input on how you can come up with some useful set-ups and what you should test/analyze.
- Volume during specific time of the day
- Volatility during specific time of the day
- Correlations ( for example sector weighting of the S&P 500, which sectors have the largest impact on the S&P 500)
- Inter-market Analysis – T-Bond
- Velocity of price change
- Previous trading day
- Trading Day of the Week
- Trading Week of the Month
As we have already shown yesterdays data (close of the trading day and next day open) has an effect on the trend direction for the following trading day and the volatility. Opening range breakout systems are influenced by yesterdays price moves. Trading imbalances can occur which influences the breakout range of the next trading day. We used the yesterday’s data simply by comparing it to the subsequent day to see if there is any price gap and to which extent it influences the trend direction.
Volume
As mentioned before it is an important piece of the puzzle. Big volume underpins the strength of the trend. It confirms the price action. Yes, we do not always have a clear pattern but that’s why you should compare the current volume relative to the previous days volume. Make use of our indicator and try to find the optimal set-up for the market you are planning to trade. For example, take the opening range breakout entry if the volume is 10 % greater than the average volume of the last X bars. In addition to entries volume can also be used to identify the support and resistance points.
Exit ATR Ratchet
For the following strategy test we will implement a more sophisticated exit technique. The exit technique was originally developed for a fund managed by Tan LeBeau LLC. The exit strategy is based on the Average True Range. The idea behind it is to pick logical starting points and then add units of ATR to the starting point to produce a trailing stop that moves consistently higher adapting to changes in volatility. The advantage of the ATR Ratchet is that it exits the position fast and it’s appropriate to changes in volatility. It enables us to lock in the profit faster than with other trailing stop methods.
Example of the strategy : After the trade has reached a profit target of at least one ATR or more, we pick a recent low point such as the lowest low of the last 15 bars. Then we add some small unit of ATR (0.10 ATR for example) to that low point for each bar in the trade. If we have been in the trade for 15 bars we multiply 0.10 ATR’s by 15 and add the resulting 1.5 ATR to the starting point. After 30 bars in the trade we would now be adding 3 ATRs to the lowest low of the last 15 bars. The exit should be used after a minimum level of profitability is reached since this stop is moving very rapidly. The ATR begins slow and moves up steadily each bar because we are adding one small unit of ATR for each bar in the trade. The starting point from which the stop is being calculated ( the 15 bars low in our example) also moves up as long as the market is headed in the right direction. So now we have a constantly increasing number of units of ATR being added to a constantly rising ten-day low. Each time the 15 bar low increases the ATR Ratchet moves higher so we typically have a small but steady increase in the daily stop followed by much larger jumps as the 15 bar low moves higher. It is important to emphasize that we are constantly adding to our acceleration for each bar to an upward moving starting point that produces a unique dual acceleration feature for this exit. We have a rising stop that is being accelerated by both time and price. When the trade makes a good profit run the ATR moves up very fast. For example 5% or 10% of one 15-bar average true range multiplied by the number of bars the trade has been open will move the stop up much faster than you might expect.
A feature of the ATR is that you can start it at any point. At a support level, trade entry or pick a low point as the lowest low of the last X bars. If you want to keep things simple you start the ATR Ratchet at something like 2 ATRs below the entry price which would make the starting point fixed. In such a case the ATR Ratchet would move up only as the result of accumulating additional time. As a rule of thumb this exit technique should only be used after reaching a certain amount of profit.
The length that we use to average the ranges is crucial, if we want the ATR to be highly responsive in an intraday trading strategy you should use a short length for the average. There are many variations possible here. Best approach is to code the ATR Ratchet and plot it on a chart to get a feeling for its behavior. This will enable you to find the best possible variables.
Parameter Optimization
Now before we move onto strategy design we want to optimize the indicators first. A caveat here, avoid over optimization. When first looking at a solid set-up we take those values giving us solid results and with no jumps in data. For example, after optimizing our Stochastic Volume Index Indicator we get the following hypothetical results :
Now when we look at the results which values for our Indicator should we choose ? No.10 for the given set-up we get +110% in gains.
no | LookBack Period | Volume Index Level | Trade Results |
|---|---|---|---|
| 1 | 20 | 10 | -10% |
| 2 | 30 | 20 | +30% |
| 3 | 40 | 30 | +40% |
| 4 | 50 | 40 | +50% |
| 5 | 60 | 40 | +47% |
| 6 | 70 | 50 | +45% |
| 7 | 70 | 60 | +53% |
| 8 | 90 | 80 | +23% |
| 9 | 100 | 90 | -15% |
| 10 | 110 | 94 | +110% |
| 11 | 120 | 100 | +50% |
| 12 | 130 | 100 | -80% |
NO ! No.10 is the wrong answer . A small change in the Index Level and LookBack period gives us a large deviation of gains ranging from -15% to +110%. This can be random and is pushing us right into the direction we do not want to go. Now have a look again. What about the results from No.3 to No.7 we have a small deviation ranging from +40% to 53% and no sudden jumps in the data set. We choose a value somewhere in between which means No.5. Is this one the best possible answer ? Again, finding the best possible one is over optimization. Our goal is to find a solid and consistent set-up with consistent results. We want to find the right cluster of possible variables and not an exact variable. Sometimes it’s not that easy like in the table above. In those cases start simple and just have a look at the chart and get a feeling for how the indicator behaves at different levels. Trading is not an exact science like some traders want it to be and sometimes you need to follow your intuition and trust your experience.
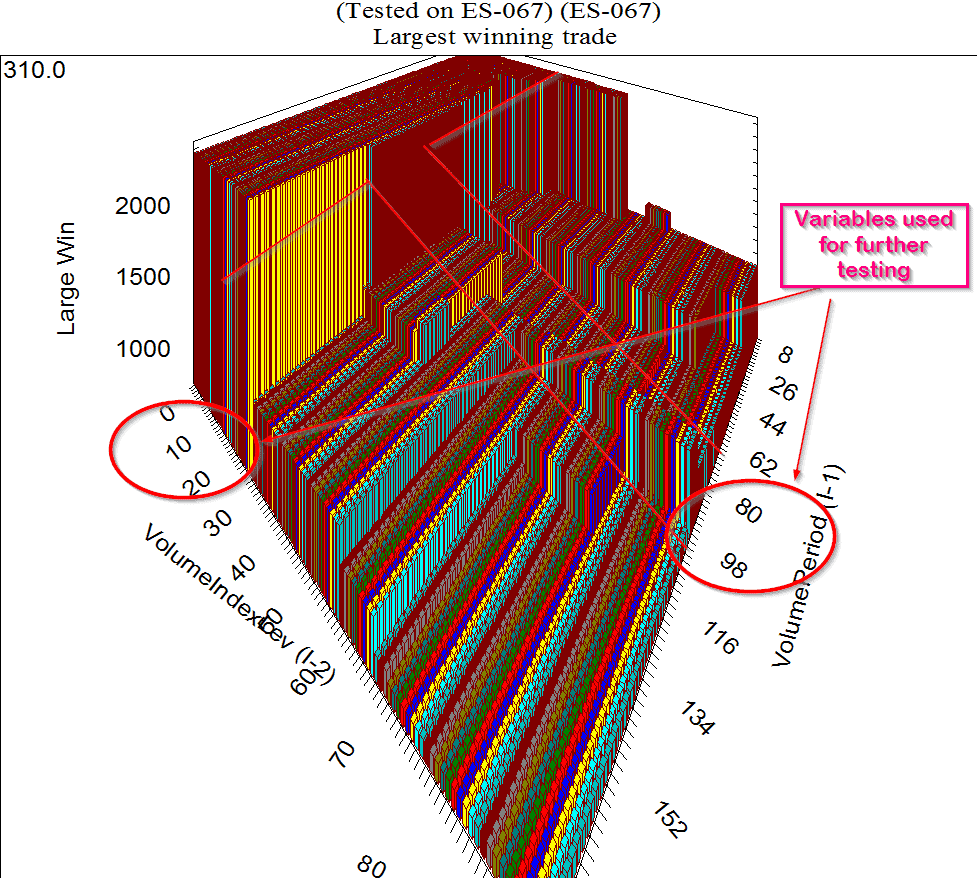
Here are the results after optimizing our Stochastic Volume Index indicator. As you can see it’s not that easy due to the larger amount of data we have.
We use an Index value between 0 and 20 for the breakout and a lookback period of 86 bars (10min. bar period).
Our next step is fine tuning the strategy and using the ATR Ratchet for the exit technique.
Strategy Optimization
Before we move on to actual backesting and strategy optimization lets summarize our trading rules so far. We are looking for a breakout during the opening range and a volume index level between 0 and 20 with a sudden price jump above the opening range for a bullish setup. We will also test the strategy for long entry on gap up days. After defining those strategy rules we can implement the ATR ratchet and further improve our results.
Final Strategy Results Long Only:
Further Research
There are many directions which can be taken for further development of this trading concept. Optimizing parameters such as the ATR Ratchet is definitely an exit technique to be further studied and leaves room for improvement. It also shows that the exit of trading strategy is more important than the entry rules as our test results including the ATR Ratchet have shown. The bar period chosen for the opening range breakout and the trailing exit methods used can make a large difference. Further optimizations can be done by selecting the best entries and exits for certain days of the week and levels of volatility (VIX).
If you like our article sign up here for more in-depth research [We publish trading strategies & research using R, Python and EasyLanguage]
Disclaimer
The information on this site is provided for statistical and informational purposes only. Nothing herein should be interpreted or regarded as personalized investment advice or to state or imply that past results are an indication of future performance. Under no circumstances does this information represent an advice or recommendation to buy, sell or hold any security.


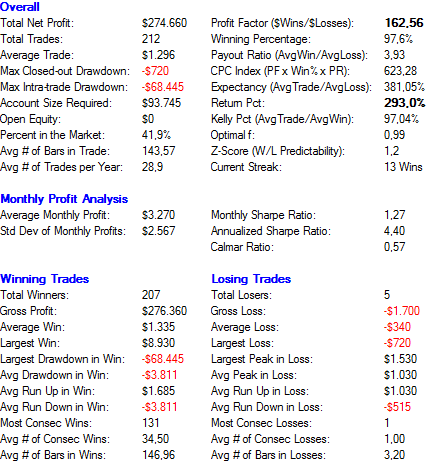
Interesting and well thought article. One of the main take-away’s from it is that the exit strategy + the vol filter change the characteristics of the whole strategy up side down. We see a change of profitable trade from 25% to 97% which is massive IMHO. BTW the volume and volatility characteristics ( 35% of highs occur in the first 30 min ) that you mentioned seems to be seen also in stocks according to my research. Good article.
Nice article. Great to see a focus on hypothesis testing, a robust development process and intelligent use of optimization tools.