


Spot Price Patterns with the COT Report
This post goes into an in depth analysis of the commitment of traders report and its usefulness for predicting price movements. The CFTC collects data on the daily positions of large participants in the commodity markets. The data is aggregated in the weekly COT report which is published every Friday at 3;30 PM EST. So the one million dollar question is whether we can use this weekly report to predict price movements in individual commodity markets ? Our focus lies on the trading group that usually leads returns. For the purpose of our analysis we will explore whether certain market participants in the crude oil market have information that isn’t available to all market participants. We will try to find out if this information is present in the COT report and therefore use the commercial short category in our calculations. The goal is to enable us to predict future price movements by quantifying the information given in the commercial short category of the COT report.
COT Report Basics
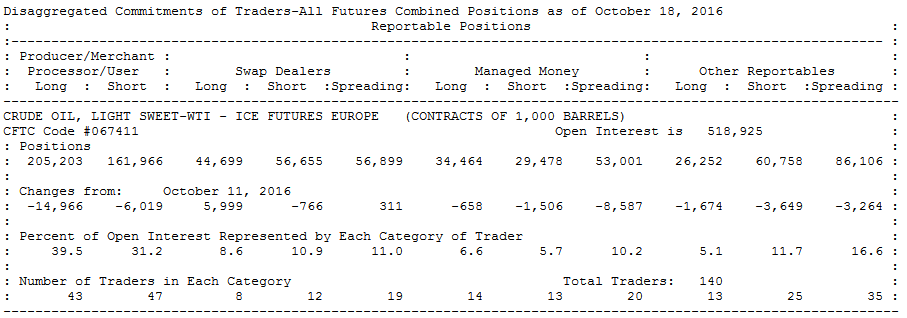
The Commitments of Traders (COT) reports provide a breakdown of each Tuesday’s open interest for markets in which 20 or more traders hold positions equal to or above the reporting levels established by the CFTC. Within the COT report traders are split into reporting and not reporting entities. The CFTC adjusts the minimum reporting threshold on a inconsistent basis . The aggregate of all traders’ positions reported to the Commission usually represents 70 to 90 percent of the total open interest in any given market. For the COT Futures-and-Options-Combined report, option open interest and traders’ option positions are computed on a futures-equivalent basis using delta factors supplied by the exchanges. Long-call and short-put open interest are converted to long futures-equivalent open interest. Likewise, short-call and long-put open interest are converted to short futures-equivalent open interest. For example, a trader holding a long put position of 500 contracts with a delta factor of 0.50 is considered to be holding a short futures-equivalent position of 250 contracts. A trader’s long and short futures-equivalent positions are added to the trader’s long and short futures positions to give “combined-long” and “combined-short” positions.
In 2009 the CFTC began with a reorganization of its original commercial and non commercial cot report by replacing them with four new categories of reportable traders: Producer/Merchant/Processor/Users, Swap Dealers, Money Mangers and Other Reportables. The new Producer/Merchant/Processor/User category replaces the original Commercials category. The report with the new categories began publication in 2009 and data with the new categories is available from June 2006.
Commercial Short Modeling
Before we proceed further to the actual analysis we need to find a model for the commercial short category which enables us to come to meaningful conclusions and trading signals. Therefore we think it doesn’t make any sense to compare longs vs. shorts within the commercials category(Producer/Merchant/Processor/User). Traders on each side of this market are clearly different. Commercials(Hedgers) are expected to be only on one side of the market. What we want to achieve is to identify the information held by commercial shorts yet not identified by a move in price. Therefore our model will focus on commercial short open interest. Our model is based on the assumption that commercial short open interest should rise when prices rise and fall when prices fall. We want to identify weekly changes in commercial short open interest. If there’s an unusual week to week price change the open interest change is ignored since we had a price move that can be explained by the change in open interest. In those cases where we don’t have a corresponding price change we have our trading signal.
Strategy Description: A sharp rise in the number of contracts held by commercial shorts is a bearish price signal. Shorts are increasing their positions locking in prices at the current level. A reduction in the number of contracts held by commercial shorts would represent a bullish price signal. Hedging activity decreases which should be followed by higher prices. For out backtest we define the trading signal as a 5% change in commercial short open interest during a one week period. A price change of 2% or less during a one week period gives us the entry signal. The position is entered on the Friday settlement price or Monday market opening. The position exit is when the price hits the 5% target in the anticipated direction. An opposite trading signal closes the position.
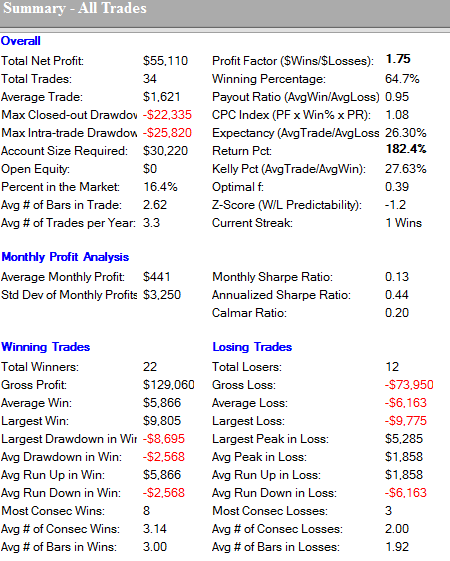
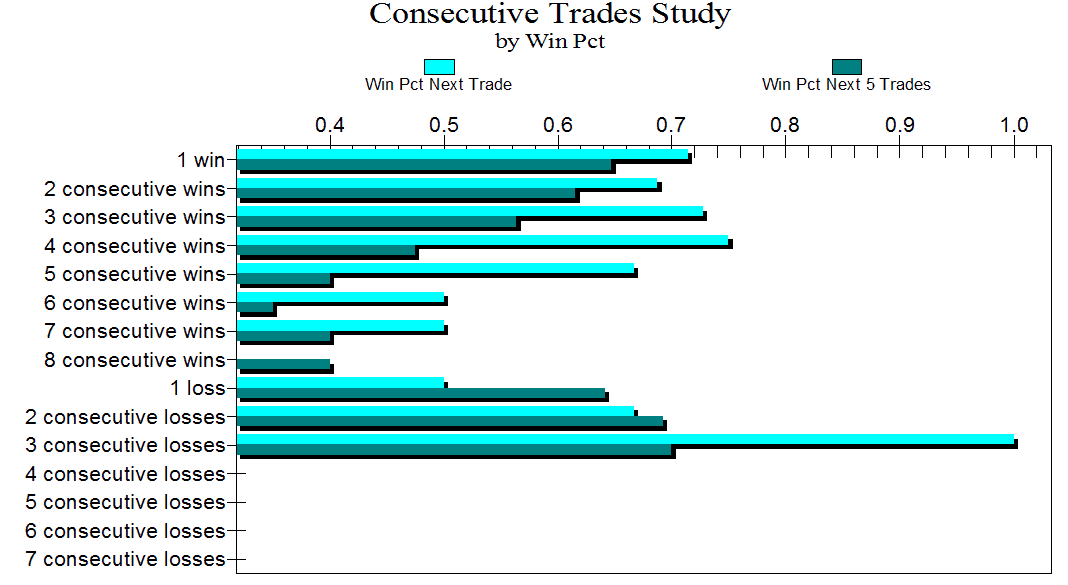
Strategy Results