


Kaufman’s Market Efficiency Model
Trend Following Methods Applied
The trend following model by Kaufman says that trading by the direction of the trend is a conservative approach to the markets. Kaufman’s Market Efficient Model states that longer trends are the most reliable but they respond rather slowly to changing market conditions. The main argument of the Market Efficiency Model is that an adaptive method must be applied to the markets for proper trend following. Therefore you need a method that speeds up the market entry. The method will not result into a trading signal if the markets are moving sideways.
The method uses an adaptive moving average to calculate the efficiency ratio indicator used to get the desired entry signals. A measure of a trends strength can be useful as some strategies work best on a trending market and some in a range bound market.
Formula for the Efficiency Ratio Indicator :
- ER = Direction / Volatility
- Direction = ABS (Close – Close[n])
- Volatility = n ∑ (ABS(Close – Close[1])) – the volatility is the sum of the absolute value of the last ten price changes (Close – Prior Close)
- n = The efficiency ratio period. – we used n=10 for our backtests
The Market Efficiency Model combines noise (volatility) and the speed of the price movement. Essentially it divides the net price movement between two time periods by the sum of the individual price movement. This gives us a ratio for the speed of the movement compared to the volatility of the market. Kaufman’s original model uses 10 days but the number can be adjusted according to the market you want to trade. The ratio can be used as a filter that can be mapped onto a range of different time frames to further improve the entry signals.
For testing purposes we look at the Sugar 11 futures market.
Testing parameters :
- Bar Period=Daily, Profit taking= $900, Stop Loss=$600,
- n=10,
- Short if efficiency ratio is greater than 0.80,
- Long if efficiency ratio is below -0.80.
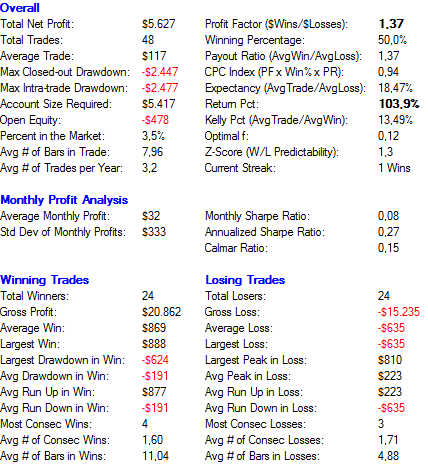
Results:
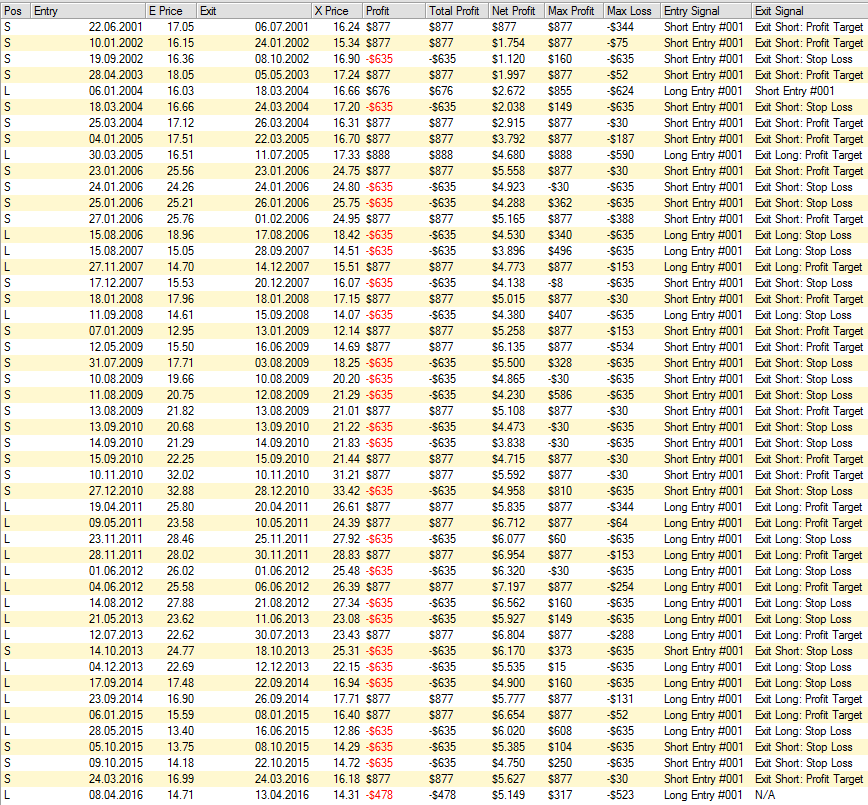
In statistical terms, the Efficiency Ratio tells us the fractal efficiency of price changes. ER fluctuates between 1 and 0. For n=10 the efficiency ratio indicator would be 1 if prices moved up 10 consecutive periods or down 10 consecutive periods.
After testing the entry signals for the different ratios we performed another test changing the n periods trying to increase the number of trades and making the results statistically more reliable. Testing parameters same as above except that the n periods for our long/short entry signals are tested for n=0-15. Number of tests: 30,976.
Results:

Optimized parameters: Profit Taking= $1000, Stop Loss= $700, Long Entry n=11, Short Entry n=6
Conclusion: The n = efficiency ratio period is greater in a uptrending market than it is for a downtrending market thus telling us that a bearish market is moving faster. In other words when entering a long position in a bearish market your stop-loss will be reached sooner than in an uptrending market. It also means when entering a short position in a downtrending market you will be able to reach your profit target at a faster pace. We performed these tests on several other markets and observed the same pattern. Encouraging you to do your own testing based on our conclusion it would be interesting to use this indicator looking at the VIX contract and combine it as an intermarket analysis looking at the S&P500/VIX spread in combination with the efficiency ratio.
Can you clarify your methods? In your description of the efficiency ratio you explain it as a ratio of two absolute values. But then in your entry criteria you state to go “Long if efficiency ratio is below -0.80.” How would that ratio return a negative value?
The formula is ER = (total price change for period) / (sum of absolute price changes for each bar). TN Code : (Close – Close.Periods) / MovingSum (Abs (Close – Close.1) , Periods , 0). When the number inside the absolute value (the “argument” of the absolute value) was positive anyway, we didn’t change the sign when we took the absolute value. But when the argument was negative, we did change the sign; namely, we changed the “understood” “plus” into a “minus”. If you want to dig deeper into this topic we recommend reading “Trading Systems and Methods” by Perry Kaufman. The ratio is especially useful when applying it as a ranking system in a multi basket trading strategy.
Then why didn’t you change the formula of ER? If you are not able to present your idea in a consistent matter, can we trust that you are able to design a winning strategy in this very difficult market environment?
Because there are variations of the formula.Both versions are correct. Some people use the absolute value and get results ranging from 0 to 1 and we used another version calculating values between -1 to +1. It doesn’t change the bottom line. Like we mentioned it before if you want to know more feel free to read the book by Perry Kaufman. If you are struggling with your system design write us an email we can help you out.