Determine Fundamental Over and Under Valuation with Gold
Brief History of Gold
Since ancient times coins were manufactured from gold, silver and other metals because of its ability to be mass-produced and standardized. It’s the ultimate storehouse of value. During the height of the Roman Empire the first widely accepted coin that had a nominal value higher than its metal value emerged, thus laying the basis for a system that differentiates between face value and token coins. However, with the decline of the Roman Empire those coins were accepted less and less and after its fall only face value coins remained in Europe. The gold coins minted by the emperor Constantine (the solidus) were used widely throughout the Mediterranean and remained the currency of the Byzantine Empire until its fall. Increasing quantities of money in circulation, growing use of notes and bank credit, and declining resources of silver during this period were factors that led to the development of the gold standard.
Let’s have a look into the present and see if we can use the gold price to measure the value of any commodity.
Formula used for calculation and testing :
For testing purposes we divide the price of the S&P500 Index by the price of Gold which gives us the spread relationship and multiply this by 100 to normalize. Then construct a 2 week average of this spread. We than construct a 20-week average of the spread. Finally, subtract the 2 period averages from the 20 period averages.
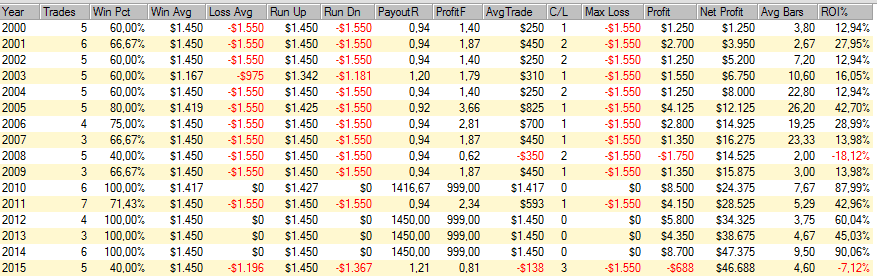
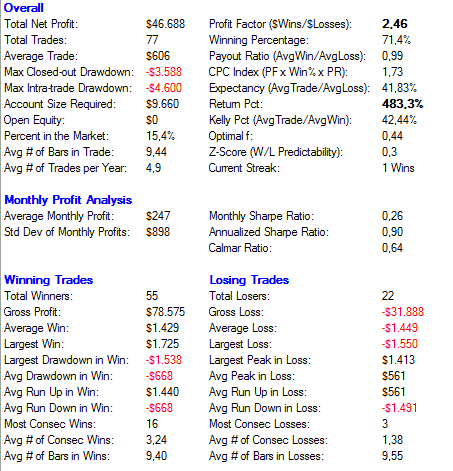
After constructing the indicator with and index value from 0 to 100 we run an optimization test to see which index values yield the best results.
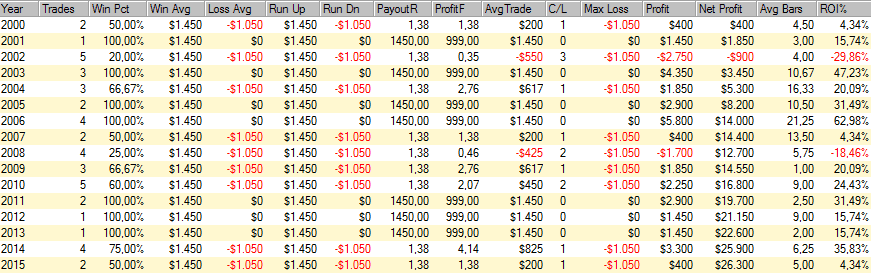
The most significant under valuation for the S&P500 Index occurred at an index level between 10 and 25. The number of trades given are not enough to use it as a standalone indicator but can serve you well viewed on a macro level and as an additional layer to your trading strategy giving you the direction of the long-term trend.
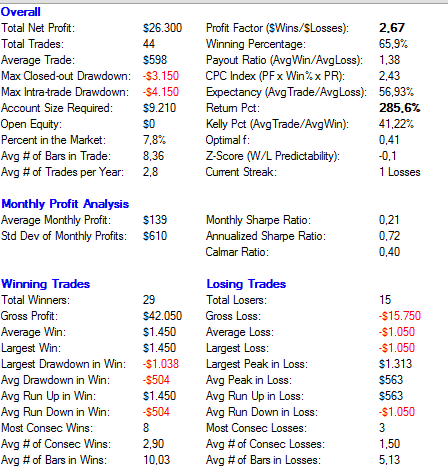
Results after 2205 runs and optimizing the weekly averages