


Mean Reversion Volatility Strategy
Ever wondered if you can design a profitable trading strategy by trading volatility ETFs ? Well, yes you can. Those ETFs are highly ineffective vehicles on a long term investment horizon. However short term strategies have shown to be a rewarding way to trade these ETFs.
Before we move onto strategy design we have to choose two volatility ETFs for backtesting. We will backtest our strategies with VXX and XIV ETFs since they are the most widely traded ones and have enough trading volume to keep our slippage low and guarantee fast order execution.
VXX
VXX and its sister fund VXZ were the first Exchange Traded Notes (ETNs) available for volatility trading in the USA. To have a good understanding of what VXX is ( full name: Barclays Bank PLC iPath S&P 500 VIX Short-Term Futures ETN) we need to know how it trades, how its value is established and how Barclays makes money running it.
The VXX can be bought, sold, or sold short anytime the market is open, including pre-market and after-market time periods. With an average daily volume of 35 million shares its liquidity is excellent and the bid/ask spreads are a penny.
The value of VXX is set by the market, but it’s closely tied to the current value of an index (S&P VIX Short-Term Futurestm) that manages a hypothetical portfolio of the two nearest to expiration VIX futures contracts. Every day the index specifies a new mix of VIX futures in that portfolio. The index is maintained by the S&P Dow Jones Indices and the theoretical value of VXX if it were perfectly tracking the index is published every 15 seconds as the “intraday indicative” value.
Wholesalers called “Authorized Participants” (APs) will at times intervene in the market if the trading value of VXX diverges too much from the IV value. If VXX is trading enough below the index they start buying large blocks of VXX—which tends to drive the price up, and if it’s trading above they will short VXX. And yes these APs are not the Red Cross they trade these restorative maneuvers at a profit.
Using VIX futures introduces a host of problems. The worst is horrific value decay over time. Most days both sets of VIX futures that VXX tracks drift lower relative to the VIX—dragging down VXX’s value at the average rate of 4% per month (30% per year). This drag is called roll or contango loss. Another challenge is that the combination of VIX futures that VXX tracks does not follow the VIX index particularly well. On average VXX moves only 55% as much as the VIX index. These facts should not scare you away since its market inefficiencies who enable capable traders to profit in the markets. Rather look at them as raw meat waiting for the Master Chef to show off his mad cooking skills.
VXX’s Exchange Traded Note structure does not require Barclays to specify what they are doing with the cash it receives for creating shares. The note is carried as senior debt on Barclays’ balance sheet but they don’t pay out any interest on this debt. Instead they promise to redeem shares that the APs return to them based on the value of VXX’s index an index that’s headed for zero. If Barclays wanted to fully hedge their liabilities they could hold VIX futures in the amounts specified by the index, but they almost certainly don’t because there are cheaper ways (e.g., swaps) to accomplish that hedge.
In fact it seems likely Barclays might assume some risk and not fully hedge their VXX position. According to ETF.com’s fund flows VXX’s net inflows have been $5.99 billion since inception in 2009—and it currently holds $1.3 billion. So $4.7 billion dollars has been lost by investors and an equivalent amount by Barclays if they were hedged at 100%. If they were hedged at say 90% they would have cleared a cool $480 million over the last 4 years in addition to their investor fees. Barclay’s affection for VXX might be understandable after all.
XIV
The VelocityShares Daily Inverse VIX ST ETN (NASDAQ: XIV) tracks the daily inverse performance of VIX futures as its benchmark. It holds around 75% of its portfolio in front-month VIX futures contracts and 25% of its portfolio in VIX futures contracts for the next month out. The futures positions have a weighted average maturity of one month. The fund began trading in 2010 and is issued by Credit Suisse. It has around $660 million AUM.
The XIV attempts to track the -1X inverse of the index on a daily basis and then rebalances investments at the end of each day. Detractors of the daily reset approach correctly note that XIV and funds like it can suffer from volatility drag. If the index reverts back to the mean a lot the XIV will lose value, whereas a true short would not. Its daily reset construction requires its investments to be rebalanced at the end of each day, and the required investments are proportional to the percentage move of the day and the amount of assets held in the fund. XIV currently holds $660 million in assets, and if XIV moves down 10% in a day (the record negative daily move is -24%, positive move +18 %) then Credit Suisse has to commit an additional $66 million (10% of $660 million) of capital that evening. If XIV goes down 10% the next day, then another $60 million infusion is required.
Strategy
After examining the modus operandi of these ETFs we can start with strategy development. We know that the XIV moves in the opposite direction of the VXX ETF since its the inverse of the VIX future. We also know that they do not perfectly track the VIX Index. Which brings us to our first rule – construct a spread between XIV and VXX based on a n-period look back period. The spread will give us values between 0 for oversold and 100 for overbought. What we want to get is an algo that will enable us to take trades based on co-integration/mean reversion of the pair spread.
Formula: We divide the price of the VXX Index by the price of XIV which gives us the spread relationship and multiply this by 100 to normalize and choose an optimized n-bar look back period.
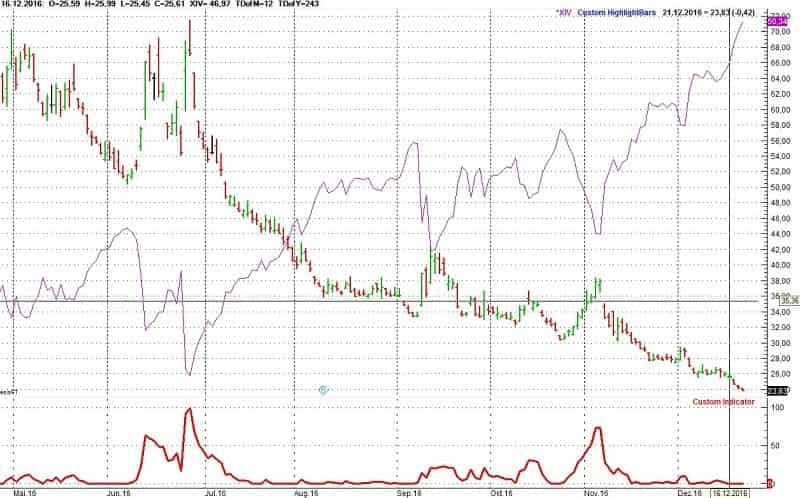
Entry & Exit Rules: Long XIV/Short VXX when spread at 100. short XIV/Long VXX when spread at 0.
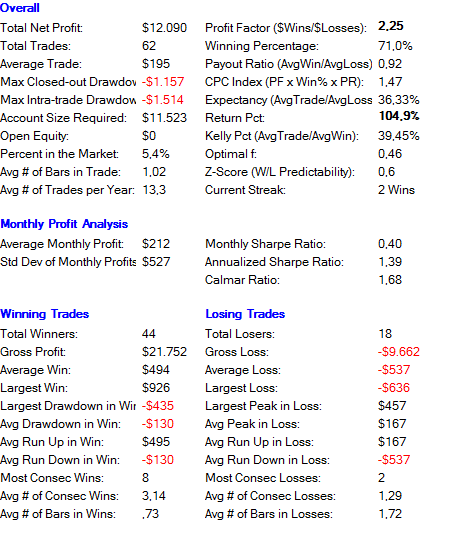
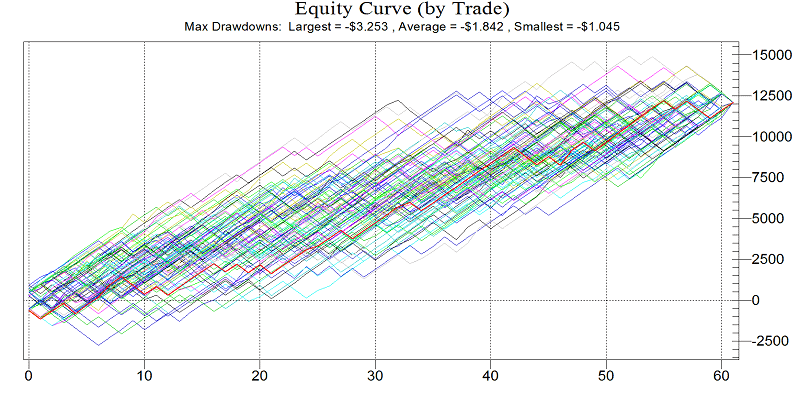
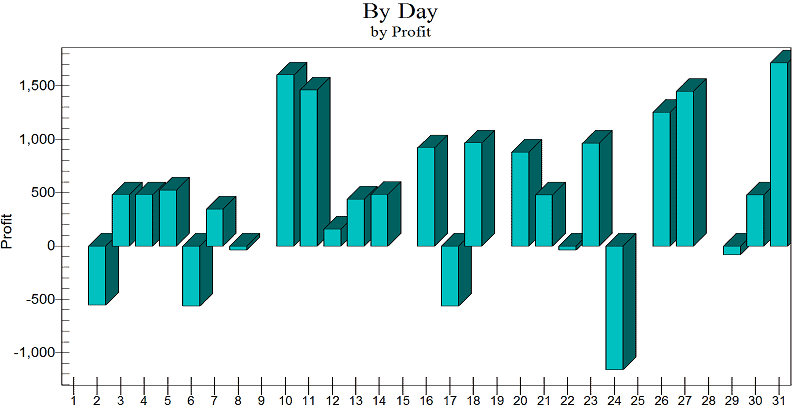
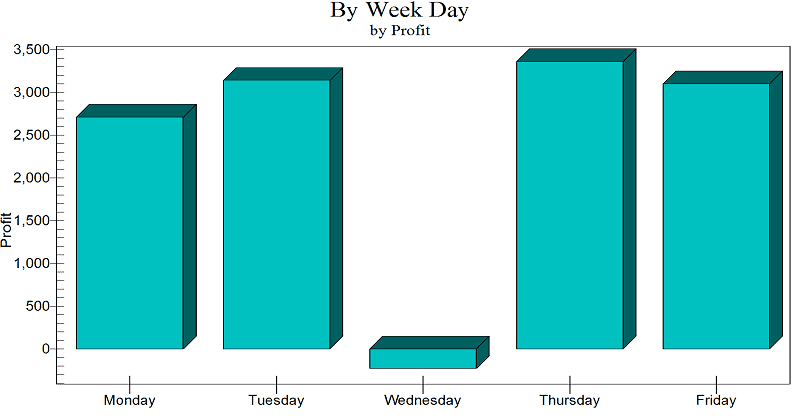
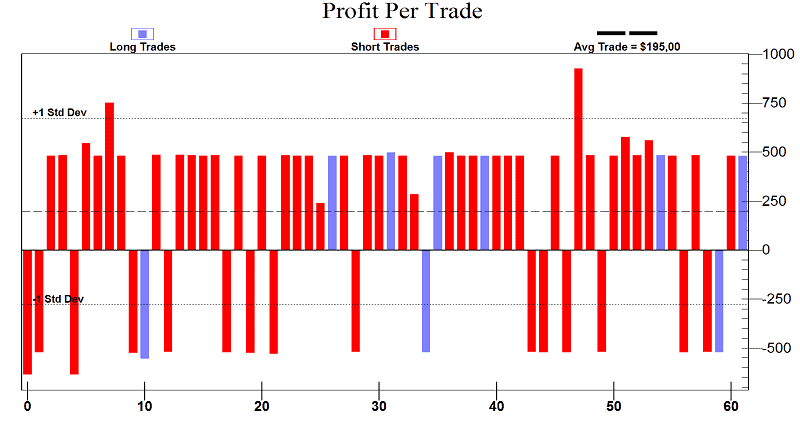
Optimized Trading Results for VXX:
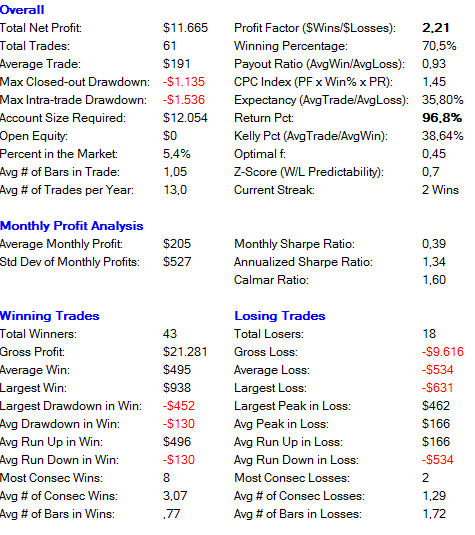
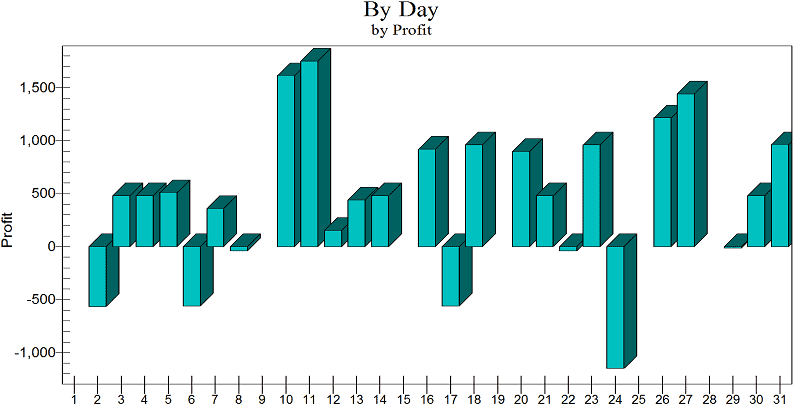
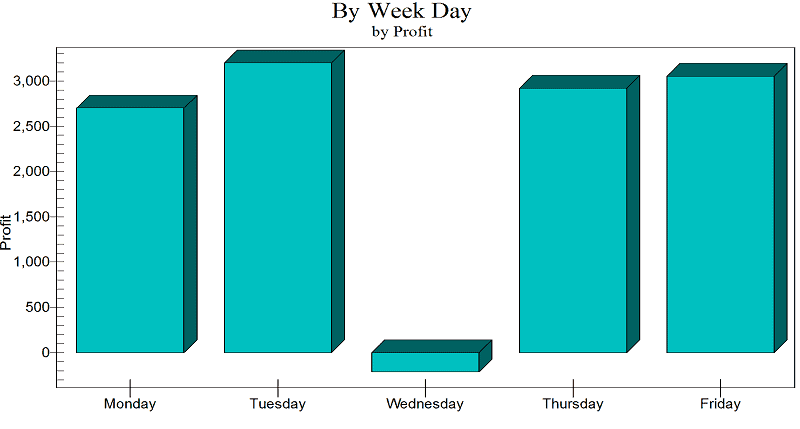
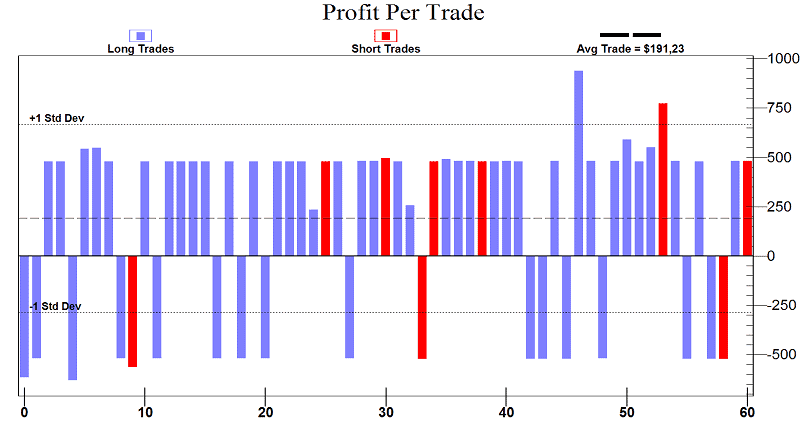
Optimized Parameters: Time Period Daily Bars, Look Back Period n=25, VXX Long when spread ratio crosses above 60, VXX Short when spread ratio crosses below 100, Trading Capital: $10.000, Profit Target $500, Stop Loss $500;
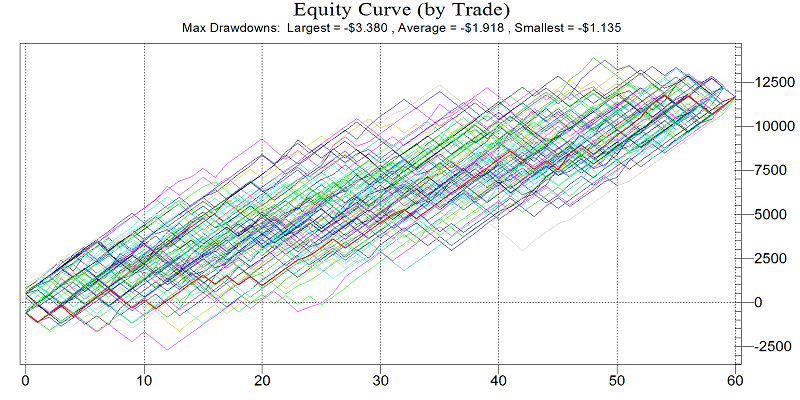
Results: After 100 Monte Carlo simulations the strategy achieves on average positive results and in the worst case scenario it took 17 trades to reach the break even point.
Optimized Trading Results for XIV:
Optimized Parameters: Time Period Daily Bars, Look Back Period n=25, XIV Long when spread ratio crosses below 100, XIV Short when spread ratio crosses above 60, Trading Capital: $10.000, Profit Target $500, Stop Loss $500;
Conclusion: The optimal factors that are originally used by the system have a different look back period. The reasons are obvious as stated before both ETFs are not efficient in tracking the VIX index. To better compare the test results we used the same look back period. This strategy boils down to buying XIV/VXX when the VIX futures are in contango and buying VXX when the VIX futures are in backwardation.

What software did you use to run the strategy?
A lot of our analysis is done in R. Machine Learning with R
did you look at how robust the optimized lookback period is ? Thanks
Values ranging from 25 up to 30 show consistent results without any sharp deviations from alpha. We optimized every parameter except stop loss and profit targets for the sake of simplicity.
Could you go into your formula process a bit more? You say you multiply VXX/XIV by 100 to normalise it. Also how do you implement the look back period?
100 * ((Close Of “VXX”/ Close Of “XIV”) – Lowest ((Close Of “VIX”/ Close Of “XIV”) , n)) / (Highest ((Close Of “VIX”/ Close Of “XIV”) , n) – Lowest ((Close Of “VIX”/ Close Of “XIV”) , n)) You can also use 100 * ((Close Of “VXX”/ Close Of “SP500”) – Lowest ((Close Of “VIX”/ Close Of “SP500”) , n)) / (Highest ((Close Of “VIX”/ Close Of “SP500”) , n) – Lowest ((Close Of “VIX”/ Close Of “SP500”) , n)) You use the denominator that best fits your model. The variable in the enumerator is the one you want to trade.