


Supercharge Seasonal Movement Analysis
How Seasonal Movement Analysis can Supercharge your Trading Results
When it comes to trading there is a common belief that most behavior in markets can be explained by assuming that market participants make ‘logical’ trading decisions. In reality we know it’s not that easy. However there are market movements that are predictable because they repeat every year. We call this seasonal movement. You don’t have to be a math wizard to see seasonal cyclic movements in assets repeating year over year. To be able to predict the movement of a particular market it’s useful to analyze the seasonal pattern over a certain time period that should usually range from 10 to 15 years.
Let’s have a look at the daily return for a particular day of the week as the return from the open of that day till the close. We examine the movements for the T Bond futures market. We enter our position according to the market opening times (For products traded solely via CME ClearPort Clearing, the hours are as follows: Sunday-Friday 18:00 – 17:00).
#Long Trades Only
Results for Monday presented as standard deviation of returns. Winning Percentage: 50.7%
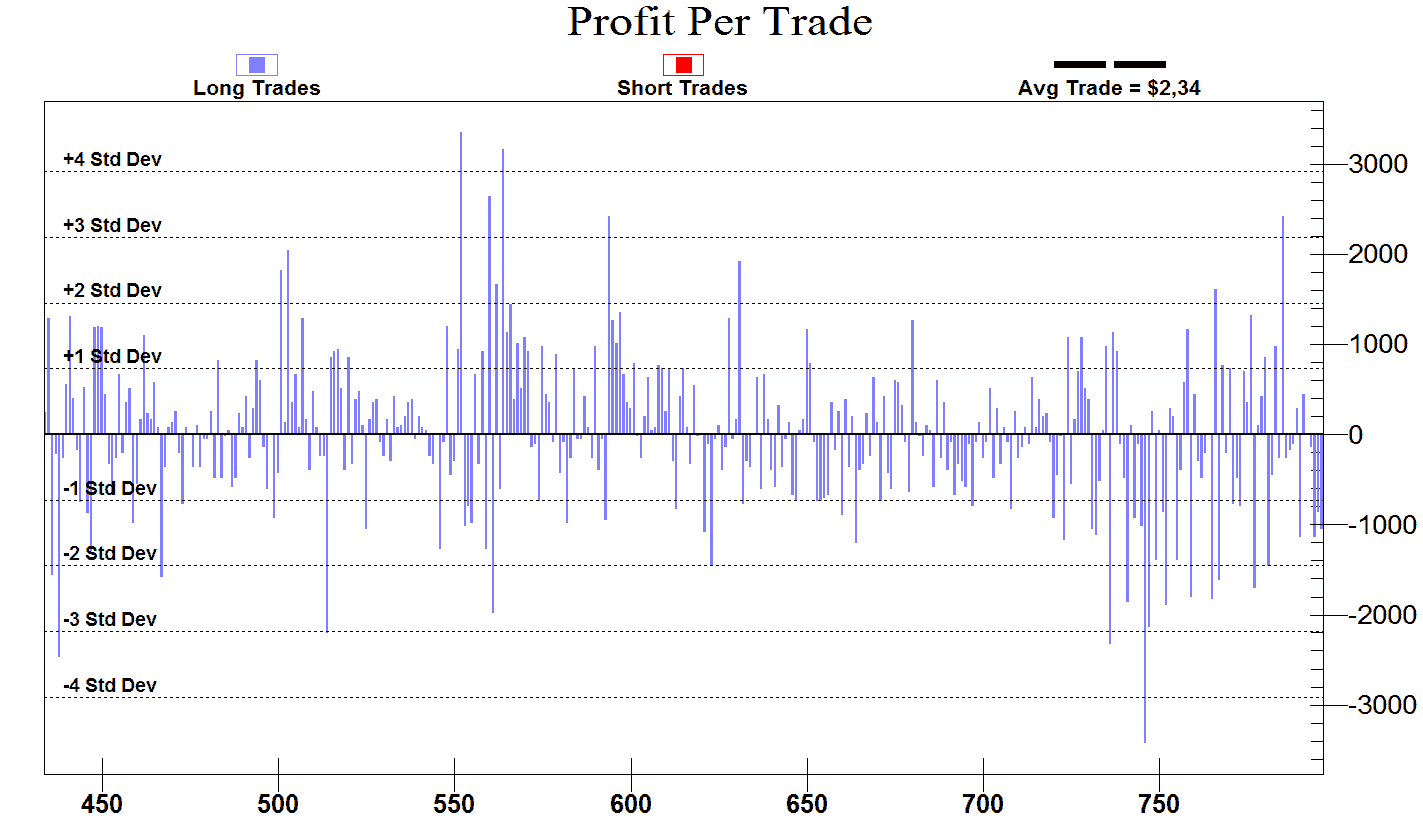
Comparing it to the other days of the week we can observe that prices rise somewhat more on Mondays than on other days. The result underpins the hypothesis that traders tend to liquidate positions on Thursday and Friday due to their unwillingness to carry their holdings over the uncertainties of a weekend. Another interesting fact is the price behaviour during February which tends to have an upward price momentum on Monday 70% of the time on average. The only exemption in which this price momentum was not present was during those trading years were we experienced a market crash (Tech Bubble March 2000, Sep. 2008 Subprime Crisis). The day with the highest volatility on average is Tuesday. Thursday tends to be the day of the week with the largest price declines.
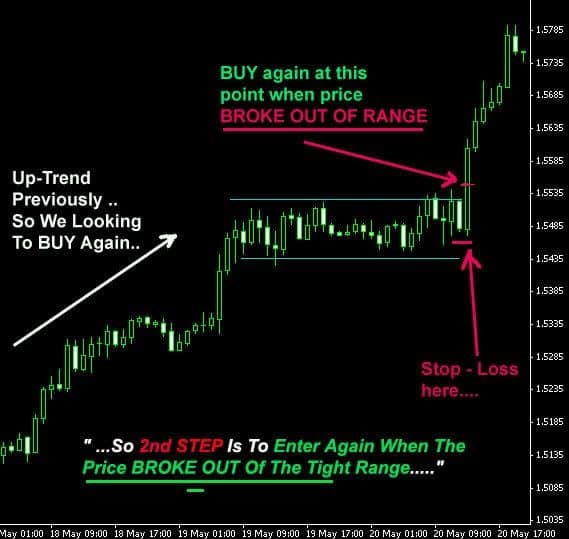
After examining the pattern for a particular trading day of the week let’s move on to the macro level. What are the seasonal tendencies/patterns for trading day of the month. Let’s examine if certain trading days of the month have a repeating pattern that can be exploited . On average we have 20 trading days every month. We test an entry/exit strategy for every trading day of the month. Our backtests optimize the profit target and stop-loss testing all possibilities ranging from $500 to $3000 in increments of $300.
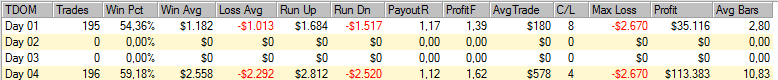
Optimized Strategy Rules: Long on 4th trading day of the month. Short on 1st trading day of the month. Exit Long Profit Target $3200. Exit Short Profit Target $3200. Exit Long Stop Loss $2600. Exit Short Stop Loss $2600.
Strategy Performance
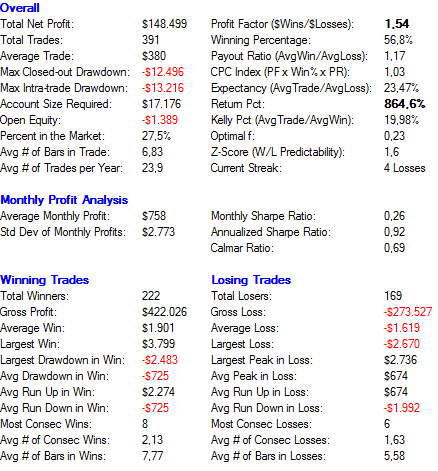
Looking at the long and short trades we can observe the same pattern across almost all assets. When the market is in a downtrend its moving at a much faster pace.
The only month with negative returns is October. It’s also the month with the highest volatility on average.

The data tested also shows a turn of the month effect. The majority of the returns occur in the first half of the month. Examining the intraday effects we have prices rising sharply during the first 60 minutes of trading.
Account Growth T-Bond DayOfMonth Strategy
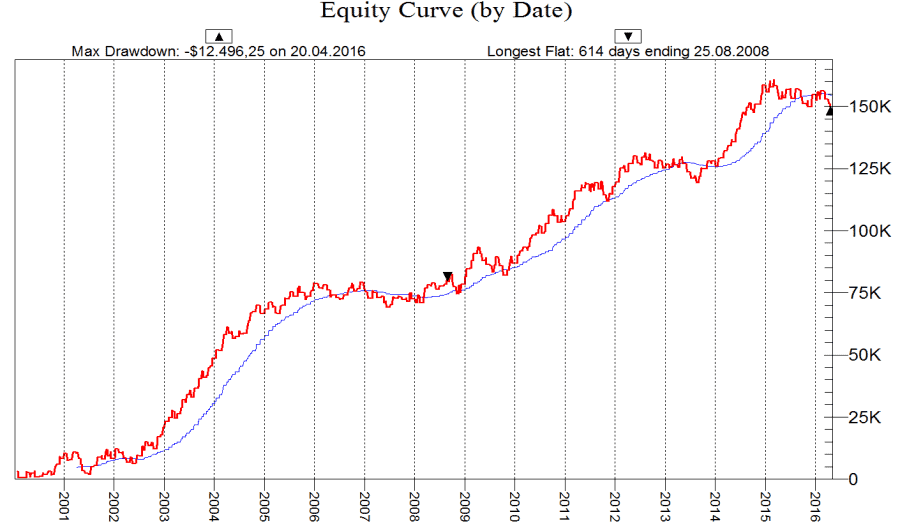
There are some hedge funds who have developed trading strategies trading only month-based seasonality. But before you start trading based solely on this one factor, there is a caveat to understand. The bullish bias on first days of the month really only works when the market is in an uptrend. When determining the state of the trend you can use other tools like the efficiency ratio that will further improve your winning percentage and timing when entering trades on particular trading days of the month.